See updated post on this topic: https://schoolfinance101.wordpress.com/2010/04/16/cartel-recap/
====
Okay… so I’m curious about The Cartel movie that documents the failures of New Jersey’s public education system… and the high costs of those failures. One might construct a reasonable statistical case for some of the problems facing New Jersey schools… but not documentary filmmaker Bob Bowdon in “The Cartel.” I’ve not seen it yet…. but their page on Facts and Figures here, includes some of the dumbest assertions I think I’ve seen in a long time:
Go to the bottom of the page where this complete moron attempts to argue that states which spend more on education have lower SAT scores… that spending more leads to lower SAT scores.
[BOWDON APPEARS TO HAVE REMOVED THE TWO CHARTS WHICH ATTEMPT TO MAKE THIS ARGUMENT. SEE COMMENT BELOW]
QUOTES/LABELS FROM THE CHARTS INCLUDED:
“THE MORE A STATE SPENDS ON SCHOOLS THE LOWER ITS KIDS’ SAT SCORES”
“EVERY EXTRA $100 IN EDUCATION SPENDING LOWERS SAT SCORES BY 1 1/3 POINTS”
He kept this statement “With spending as high as $483,000 per classroom (confirmed by NJ Education Department records), New Jersey students fare only slightly better than the national average in reading and math, and rank 37th in average SAT scores.” On his “The Deal” page…
In fact, there may be a connection… that is… states that spend more which happen to be in the northeast, happen to have higher SAT participation rates… because northeastern colleges and universities use the SAT. 82% of New Jersey students take the SAT. This figure is 9% in Alabama and 4% in Mississippi, and students taking the SAT in those states tend to be the select few interested in attending competitive northeastern colleges. So, we’re comparing the top 4% of Mississippi students to the 82% of NJ students. Anyway… that absurdity aside, here’s a better picture of how the relationship between state spending on schools relates to state average outcomes. The following four graphs show the relationship between predicted basic state and local revenue per pupil (controlling for sparsity, econ. of scale, state poverty rates, ELL children and regional wage variation) and National Assessment of Educational Progress 2007 scores. Actually, somewhat to my own surprise there is a reasonably positive relationship here. THAT SAID… I DO NOT ASSUME THIS TO BE A SIMPLE DIRECT CAUSAL RELATIONSHIP. There are many potentially interesting underlying stories that might be told here about regional differences in income, adult population education levels, tax policy structures, etc.


Anyway… for me… this foolishness has reduced significantly any interest I may have had in actually seeing the movie. Ignorant… juvenile… silly… I’m not even sure how to classify this attempt at a “brilliant revelation” from a scatterplot (FYI – I used to teach my 7th graders how to do this stuff… and draw appropriate inferences…not this kind of crap.)
I was initially pleased to see that the “facts and figures” page on the site actually had links to reasonable facts and figures and reports… rather than making them up off the cuff…(a topic I’ve written about with regard to teacher salaries, administrative salaries, Abbott spending and many other related topics – https://schoolfinance101.wordpress.com/2008/12/09/notes-from-a-school-finance-curmudgeon/).
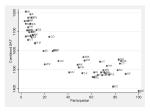
Here’s the relationship between SAT participation rates and SAT combined scores.

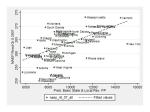
By the way… this graph I previously posted compares teacher salaries other professions holding similar degree levels, at similar age, over time in NJ. And these are hourly wage comparisons. Interestingly, teachers have fallen further and further behind over time.
========
And here’s where NJ actually stands on corrected spending measures and standardized outcomes:


The more I ponder this, the more infuriatingly stupid it is. This absolute dip$*&% goes so far as to argue that “every additional $100 in Education Spending lowers SAT scores by 1 1/3 points.” (based on his childish little annotated scatterplot). What a complete freakin’ moron! I have a hard time believing that the film is any more compelling than this crap.
Oh dear. The movie is based on wing-nut talking points. It sounds like the writer got his background research from an outfit with the lovely name of “Separate of School from State.” It’s a quasi christian reconstructionist organization.
You know it’s wing-nut land when teacher unions/organizations (this definition depends on the state), are called “cartels.”
Jeepers.
But the movie got some major play in yesterday’s Star Ledger. No wonder that newspaper is in trouble. The reporter was a stenographer……
I encourage you to take your thoughts directly to Bob Bowdon at info @ TheCartelMovie.com.
I’m sure he is willing to discuss these points with you further.
The problem for me is that the SAT analysis is representative of the level of critical analysis Bowdon was conducting while preparing to release the film. The film is done. This “analysis” is presented as “Fact.” If this analysis is so crude and poorly conceived why should I believe the film is any better? And what can Bowdon do about that now?
It would appear that Bowdon has now removed the ridiculous SAT analysis.
see: http://www.bowdonmedia.com/doc/web/faf.html
Unfortunately, the fact that it was there to begin with as evidence of Bowdon’s inferential wisdom while crafting the film, and that his other arguments and use of data appear no more compelling (see https://schoolfinance101.wordpress.com/2009/06/17/vacuous_bowdon/), the removal of the two graphs doesn’t create any greater level of credibility for the film.
Just found the original Bowdon, Cartel “Facts & Figures” graphs here:
http://www.njecea.org/cartel/?page_id=10