The rhetoric about our decades-long drunken spending spree just won’t stop, nor will the rhetoric that the money is all gone. All of it. Nothin’ left. We spent it all. We taxed ourselves to the limit and those damn teachers unions and public schools just took it all and left us with the bill. It’s gone! all gone!
Here are some recent quotes/comments from pundits who’ve done little analytically but to offer a few absurd back of the napkin explanations for why they believe that a) we’ve been on a drunken spending spree and b) it’s all gone!
Andy Rotherham in Time:
the golden age of school spending is likely coming to an end.
http://www.time.com/time/nation/article/0,8599,2035999,00.html
There’s so much more in this article, including statements about how it’s plainly obvious that for each worker added to a private firm, there is an immediate incremental return in production output (each additional worker adds $x worth of output to any private firm) whereas in education we continue to add workers and see nothing in return. Both parts of this assumption are… well… just nutty.
So, Rotherham has given us the argument that our “golden age” of school spending is coming to an end. And Mike Petrilli, in a twitter-battle with Diane Ravitch has laid down the Petrillian Truth (roll with that one Mike…it’s got a nice ring) that “The Money is Gone!”
MichaelPetrilli: That’s a great line, Diane, but it doesn’t solve the problem. The money is gone. We have to help schools cut smart.
http://educationnext.org/in-which-i-debate-diane-ravitch-in-140-characters-or-less/
That’s right. It’s all gone. It’s freakin’ gone. Cut, cut, cut. Cut it all. Zero out public education. It doesn’t matter what state you live in, what part of the country, your state has taxed you to the limit and has spent it all on the edu-bureaucracy. Every state… the whole nation has simply been pouring money into schools and they have to stop because the money is gone.
Okay, really, how much is gone? And has any of it come back yet? Is it really all gone forever? Is 20% gone, 50%, or perhaps even 70%? Must we reset the system to an average cost that is, say, 20% below where it was in 2008? 10?
You know, there are actually legitimate researchers and organizations out there tracking the condition of state and local revenues. And while these have been some tough times, their findings are somewhat less apocolyptic than the comments of Rotherham and Petrilli above… who don’t actually look at state budget data when making these claims. Here are the findings from the most recent quarterly report from the Rockefeller Institute:
The Rockefeller Institute’s compilation of data from 48 early reporting states shows collections from major tax sources increased by 3.9 percent in nominal terms compared to the third quarter of 2009, but was 7.0 percent below the same period two years ago. Gains were widespread, with 42 states showing an increase in revenues compared to a year earlier. After adjusting for inflation, tax revenues increased by 2.6 percent in the third quarter of 2010 compared to the same quarter of 2009. States’ personal income taxes represented a $2.5 billion gain and sales taxes a $2.0 billion gain for the period.
www.rockinst.org
Yes, revenues are down. State revenues are still rolling in about 7% below where they were in 2008, but in most states have begun to rebound… in order to reach that level. We took a hit. States took a hit. Some took a bigger hit than others and some are rebounding more quickly and others more slowly.
But, I must also reiterate that not every state really put their heart into public schools or the combination of their elementary and secondary and higher education systems to begin with. Many have already been systematically reducing their spending effort for years.
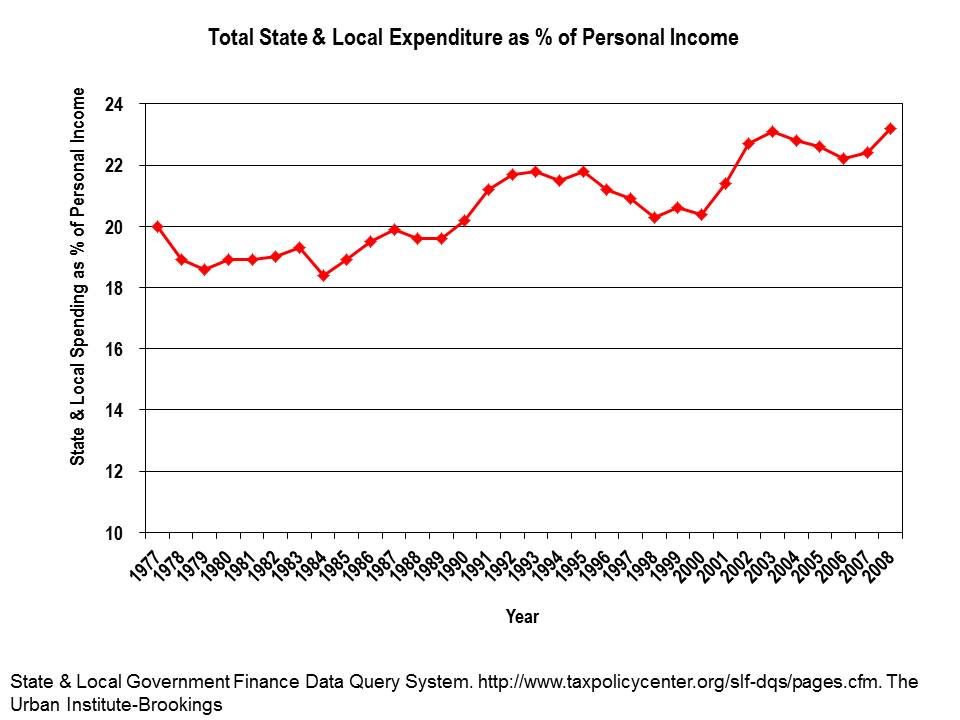
A few national graphs first. Here’s total state and local government expenditure as a share of personal income over time.Yes, on average, it has climbed slightly over 30 years. And, it has oscillated in between, with government expenditure (state and local) declining as a share of personal income during those periods when personal income grew quickly.
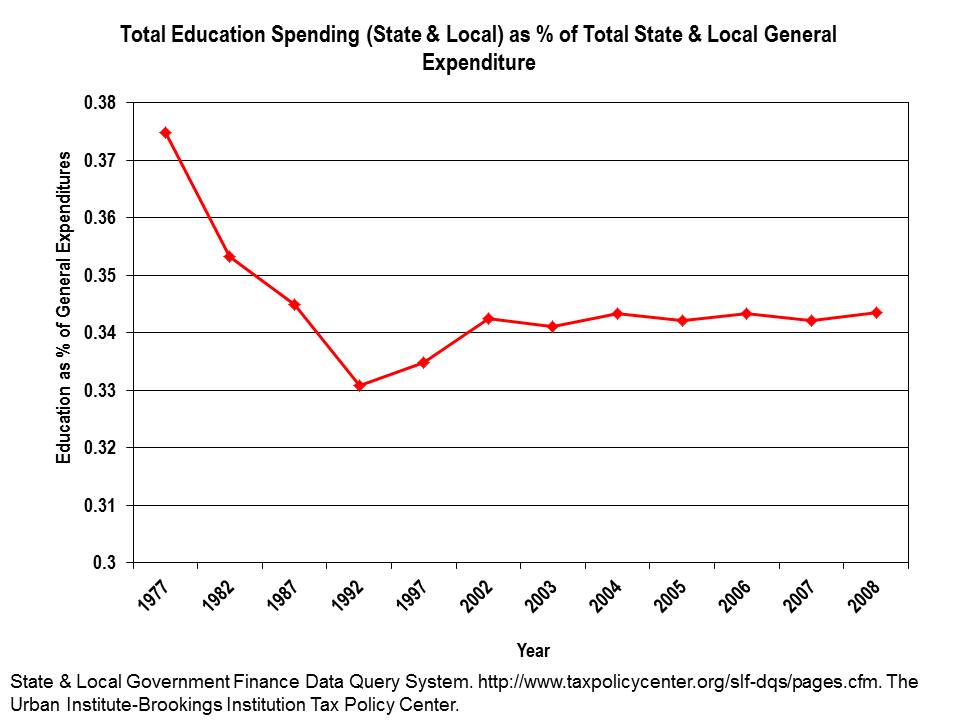
Elementary, secondary and higher education do make up a sizable share of this spending – albeit not clearly a drunken spree. Here’s education direct expenditures as a share of state and local general expenditures over the same time period.
So, the reality is that education spending first declined as a share of general spending and has since leveled off. So actually, it may be some of that other stuff that’s creating pressure on the system, a point duly acknowledged by Rotherham. But, the current argument seems to be that public schools are discretionary – negotiable – and all of that other stuff is not. Either way, even the total growth in the previous figure is not that disconcerting. A whole other discussion for a later point in time is the issue of how many states have kicked non-current expenditures (pension obligations and other debt) down the road for someone else to deal with.
Most importantly, however, here are the differences in direct education spending as a share of personal income across states. When it comes to public K-12 and higher education systems, states vary widely. Some have provided high levels of support for schools, allocated that support fairly and maintained appropriate levels of effort to finance their education systems. Others have thrown their education systems under the bus. They don’t need some data-proof ideologue to tell them that the money is gone and now’s the time to cut.
This figure, like the ones in my previous “bubble” post, shows the variation in “effort” across states – measured somewhat differently – but same conclusion. That’s the thing – I keep taking different angles on these data and they keep telling me similar stories – that many states have actually systematically reduced their “effort” to finance public education systems over time, and yes, some have increased effort. And, there’s an interesting story behind each trend. Again, Vermont has systematically scaled up education spending relative to personal income over time. New Jersey has increased over time as well, but New Jersey has only risen to a relatively below average position over time. By contrast, Colorado and Arizona both provide LESS DIRECT SPENDING ON EDUCATION AS A SHARE OF PERSONAL INCOME IN 2008 THAN THEY DID IN 1977!!!!!!!!!! And they are not the only ones. Perhaps those states need a correction in the other direction?
It will indeed be interesting to see how these “effort” measures shift as income takes a temporary hit and a bigger one that it has in the past. Most of the differences in the level of “effort” in the above figure are a function of income. States with higher personal income are able to raise what they need in education spending with a much smaller share of income. Even New Jersey, which is a relatively high spending state has relatively low effort. Other lower effort states include Connecticut and Massachusetts.
But, back to the point – These national aggregate claims that we’re tapped out – all of us – and every state – are entirely inappropriate and irresponsible. Let’s take a hard look and a more precise look at what’s really going on. Let’s focus our attention on useful quarterly reports like those from Rockefeller Institute on the condition of state revenue and lets provide appropriately differentiated instruction to states based on the widely varied conditions they face and the widely varied levels of effort they’ve applied thus far toward improving their education systems. The current rhetoric is unhelpful, and sadly, I think that’s the point!


One thought on “Still searching for that pot of gold”
Comments are closed.