Mike Petrilli over at TB Fordham has made his case for why differences in national economic context do little to substantively explain variations in PISA scores.
He frames his argument in terms of Occam’s Razor, as if to sound well informed, deeply intellectual and setting the stage to share profound logical argument, summarized as follows:
“among competing hypotheses, the hypothesis with the fewest assumptions should be selected.”
Petrilli asserts that while some might perceive a modest association (actually, it’s pretty strong) between national economic context and average tested outcomes in math, for example… like this…
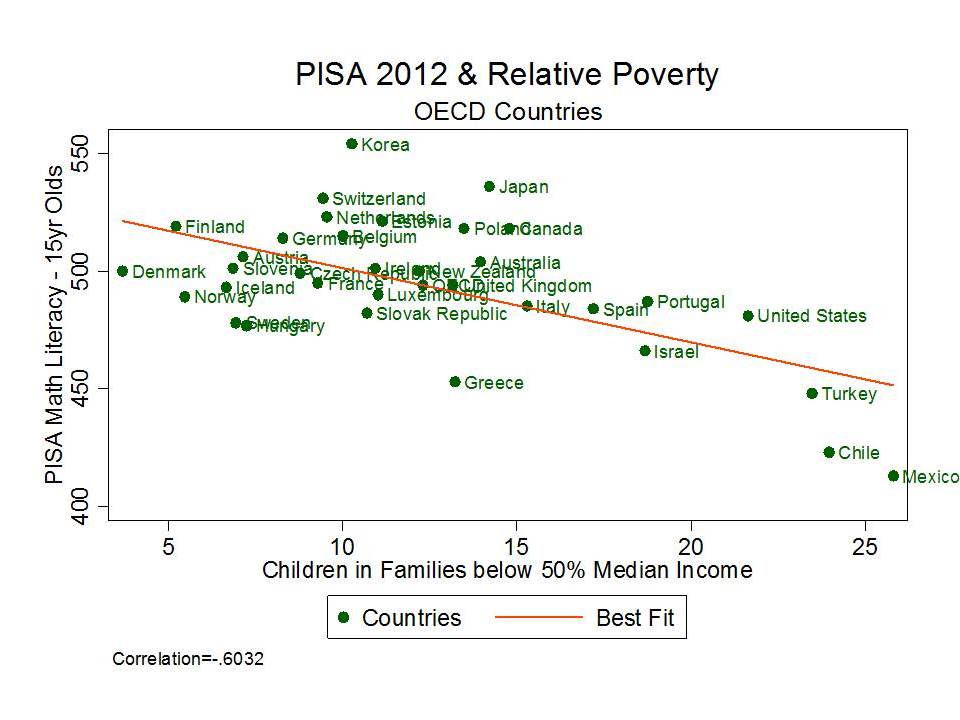
…that it is entirely illogical to assert that child poverty has anything to do with national aggregate differences in math performance at age 15.
That is, the various assumptions that must be made to accept this crazy assertion – that economic context matters in math performance – simply don’t hold water in Petrilli’s mind. Rather, the answer must be much simpler and lie in the classroom, with our good ol’ American ineptitude at teaching math.
As Petrilli concludes in his post:
So what’s an alternative hypothesis for the lackluster math performance of our fifteen-year-olds? One in line with Occam’s Razor?
Maybe we’re just not very good at teaching math, especially in high school.
Accepting the bad math teaching conclusion simply requires fewer tricky assumptions than asserting any role for economic context in determining national aggregate outcomes.
Let’s call this Petrilli’s Hammer! as an illogical, blunt & necessarily under-informed alternative to Occam’s Razor. When in doubt – when too lazy to develop disciplined understanding of the field on which you choose to opine and when data are just too hard to handle, get that hammer and everything can look like a nail! (e.g. the bad teacher conclusion)
These two quotes frame Petrilli’s argument:
First, one must assume that math is somehow more related to students’ family backgrounds than are reading and science, since we do worse in the former. That’s quite a stretch, especially because of much other evidence showing that reading is more strongly linked to socioeconomic class. It’s well known that affluent toddlers hear millions more words from their parents than do their low-income peers. Initial reading gaps in Kindergarten are enormous. And in the absence of a coherent, content-rich curriculum, schools have struggled to boost reading scores for kids coming from low-income families.
AND
So the second assumption must be that “poverty” has a bigger impact on math performance for fifteen-year-olds than for younger students. But I can’t imagine why. If anything, it should have less of an impact, because our school system has had more time to erase the initial disadvantages that students bring with them into Kindergarten.
The problem is that both of these statements are a) conceptually foolish and b) statistically ignorant.
Let’s tackle the second issue conceptually first. These scores for 15 year olds are performance level – or status scores. Status scores reflect the cumulative effects of schooling and family background. Most notably in this case, status scores – math performance at age 15, reflect the cumulative influences of poverty – living in poverty – growing up in poverty – lacking resources over long periods of ones’ early life.
Here’s some more reading on poverty timing and cumulative effects.
And then there’s this report which I prepared last summer with ETS.
So… setting measurement issues aside here, we can logically expect gaps between lower and higher income kids to grow between earlier grade assessments and later grade assessments – if we choose to do little or nothing in policy terms about the circumstances under which these children live. Yes, we can and should leverage resources in schools to offset these gaps. But we’re not necessarily applying those resources either.
Accepting Petrilli’s second point above requires that we ignore entirely that our school system remains vastly disparate in many states and locations between rich and poor communities and reinforces (rather than erasing) the initial disadvantages that students bring with them to Kindergarten.
Now, backing up to his first point, where Petrilli argues that if higher poverty settings/contexts do worse relative to lower poverty settings on math than on reading assessments, there must be a simple answer for the math problem/disparity – like bad math teaching of course. There can be no logical explanation for why math scores might be more sensitive than reading scores to poverty variation. Assuming bad math teaching to be the reason for greater disparity in math than in reading is much simpler than exploring why it might appear that math test scores are more sensitive to context/poverty, etc. than reading scores. This is true because we all know that poverty affects reading more than math – or so Mike says without citation to any legitimate source validating his point.
This one is pretty simple. First, it may simply be the case that Mike Petrilli is wrong on all levels here. That conceptually and statistically, economic deprivation seems to have stronger affect on numeracy than on literacy. But even accepting the idea that poverty affects literacy more – in a substantive way – doesn’t mean that we’d find a stronger statistical relationship between a) variations in poverty across settings and b) variations in measured outcomes across settings. The fact is that variations in math assessments are often simply more predictable. They may be both more stable/consistent and may actually have more variation to predict.
Empirical Illustrations
I’m going to use state level NAEP data within the US here to provide statistical illustrations for the rather simple flat-out-wrongness of Mike Petrilli’s Hammer.
The following illustrations simply reveal how data of this type tend to play out, something anyone reasonably well versed in using assessment data along side economic data, at various levels of aggregation, would understand. Some of these patterns reveal conceptually sound underlying hypotheses, and some may simply be an artifact of typical issues occurring in the measurement of student outcomes at different ages and in different subjects.
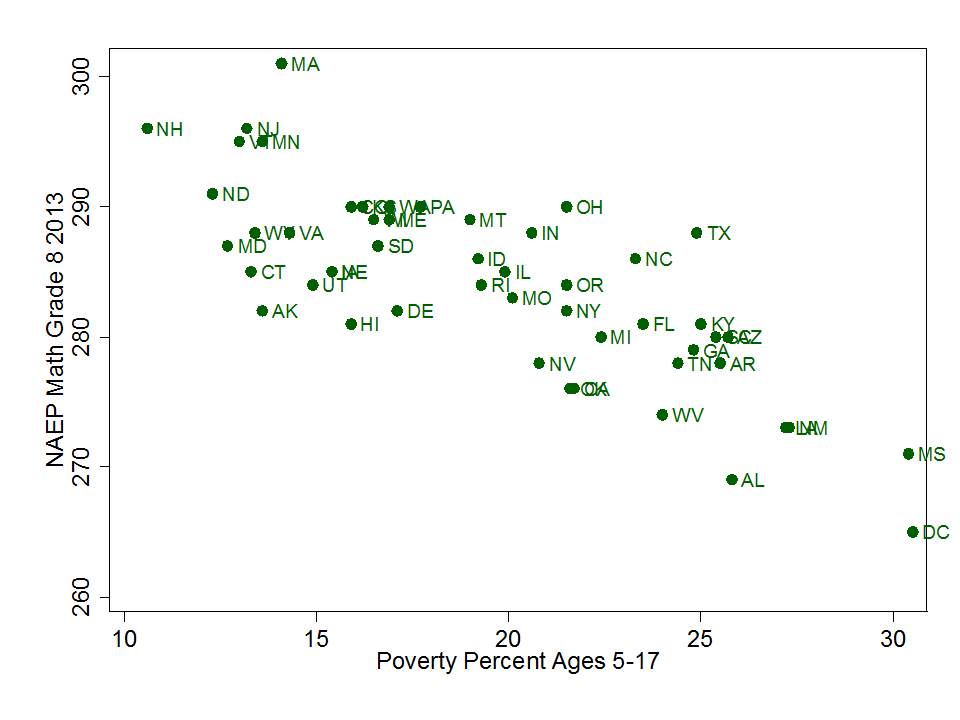
So, for our first question we ask whether it can possibly be the case that there exists greater disparity in math outcomes in 8th grade than in 4th grade across US states of varying degrees of poverty (setting aside the substantive explanations for why such gaps increase).
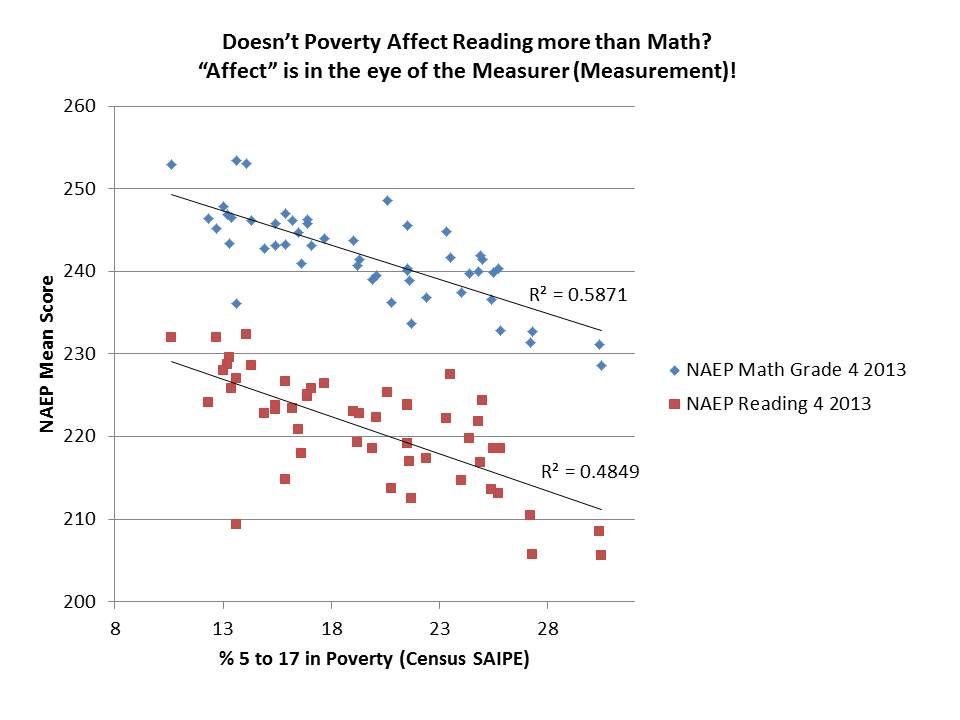
Now, careful here, this one requires using a little algebra – slope/intercept analysis. The first figure here shows the variation in NAEP math outcomes for 8th graders and for 4th graders, both in 2013.
This figure shows us first of all, that 8th grade math scores are more predictably disparate as a function of poverty than are 4th grade math scores. For 8th grade, poverty alone explains 63% of the cross state variation in math scores, but marginally less (59%) for 4th grade.
The figure also shows us that by 8th grade, an additional 1% poverty is associated with 1.13 point lower state average scale score, whereas in 4th grade, 1% higher poverty rate is associated only with .83 points lower in state average scale score. That is, the negative slope is greater for 8th than for fourth grade.
There can be many, many reasons for this. Among these reasons might be that as time goes on, cumulative poverty related deficits do increase. Persistent disadvantage makes gaps grow. It may also be a measurement issue, pertaining to the precision of measurement of mathematics knowledge and skill, or it may even be an issue of the stability and predictability of tests on early grade math content given to 9 year olds versus tests on stuff like algebra and pre-algebra given to older, hopefully more mature kids (who’ve also taken far more tests by that time).
But, instead of gettin’ all thoughtful about these possibilities and arming ourselves with well-conceived arguments grounded in data and knowledge of the literature, we could simply use Petrilli’s Hammer to assert that the one and only logical answer is that math teachers in high poverty states like Alabama and Mississippi suck and math teachers in low poverty states like New Jersey and Massachusetts rock! It’s bad math teaching that is making this negative slope get worse between grade 4 and grade 8 – bad math teaching exclusively in high poverty states!
Is there greater disparity in Grade 8 Math than in Grade 4 Math by Contextual Poverty?

The next question then is how can it ever be that math scores might be more disparate as a function of poverty when we all know that poverty affects reading more?
The next figure shows the relationship between poverty by state, and math and reading scores in grade 4. Rather amazingly, math scores are more predictable as a function of poverty than are reading scores – note the difference in variance explained (r-squared). Now, (almost) anyone who has ever plotted reading and math “level” (status) scores, or even estimated value added scores for reading and math in relation to poverty or nearly any other covariate knows that this is common. Variation in math scores – level or value added – is often much more predictable than is variation in reading scores. As above, this may be for many, many reasons. Maybe we’re just not as good on the measurement side at teasing out differences in underlying skill on reading, with either 9 or 14 year olds?
That math scores are more predictably a function of poverty than reading scores – across states – doesn’t mean that our math teaching is better or worse than our reading teaching. Even though the math scores at 4th grade are more predictable than the reading scores, the reading slope appears slightly more disparate (steeper negative). And that doesn’t mean either that our reading teaching is more disparate, or that the 4th grade scores are picking up some differential on the baggage kids bring to school with them. It’s a statistical artifact of the data – based on how math and reading are being measured. It may mean something, but who knows what? It may mean absolutely nothing.
Are Grade 4 Math Scores more predictably a function of poverty than Grade 4 Reading Scores across contexts?
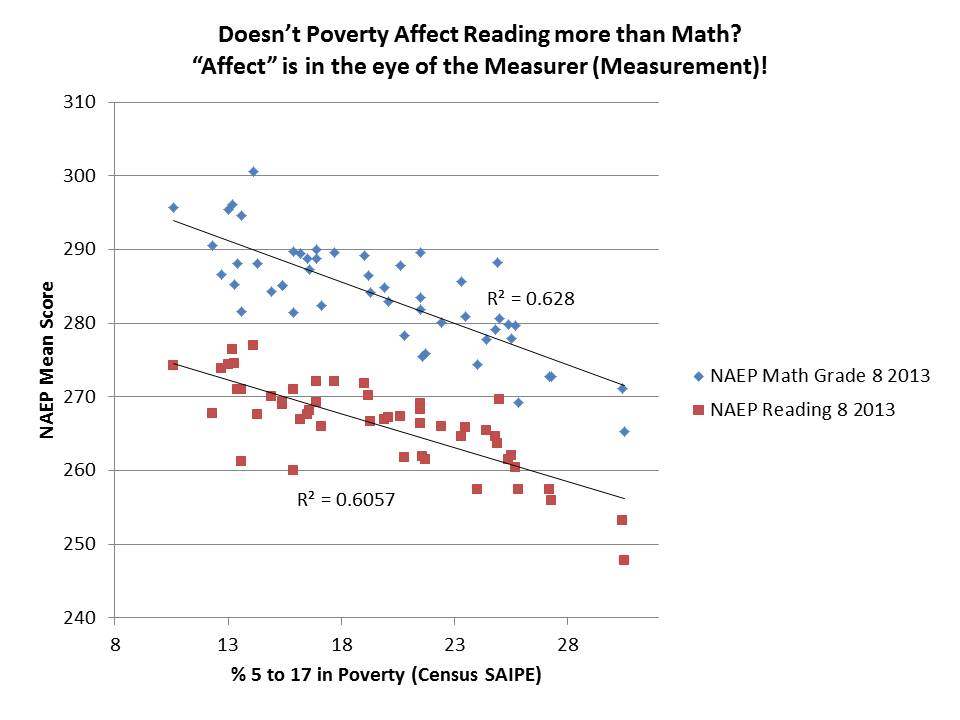
Finally, here’s the 8th grade math and reading. Here, math is marginally more predictable as a function of poverty and math outcomes are more disparate as a function of poverty.
At least by these measures – NAEP math and reading scores – aggregated to the state level – which is similar to making national comparisons – reading is NOT as Petrilli so confidently argues above “more strongly linked to socioeconomic class” than math.
International comparisons work much the same.
What about Grade 8 Math and Reading?
Indeed, Petrilli is attempting to assert that there exists an incongruity between the data and the underlying reality – that yes, reading scores are affected by poverty, but math not so much. Thus, if the data show that math scores are more affected by poverty than are reading scores, then something much more nefarious must be going on – Yes – the bad teacher/teaching problem!
It couldn’t possibly have anything to do with measurement issues or the significant possibility that the full range of student outcomes measured are similarly affected by economic deprivation. That would just be way too much to swallow.
But, if we want to go there… if we want to accept Petrilli’s argument that there’s simply no excuse for U.S. students to fall where they do on international math comparisons, because poverty doesn’t affect 15 year olds or math, only younger kids and reading, then we must apply Petrilli’s hammer to state-by-state comparisons as well.
And thus we logically conclude that math teaching in DC, MS, AL, LA stink and math teaching in NJ, MA VT and NH is great! And that poverty really has nothing to do with it?

Petrilli’s purpose was not to inform or even to ask decent questions. His sole purpose, as usual, was to confuse and divert attention with irrational drivel. As you pointed out, his hammer is a tool to wreck true understanding of issues via the application of the blunt force of purposeful stupidity.
Didn’t Leon Trotsky say that art should be a “hammer not a mirror”?
I feel for poor Mike. Talk about being hit by a hammer…
Reblogged this on Transparent Christina.
“If Petrilli had a hammer/he’d hammer in the mo-ooor-nin’/he’d hammer in the evenin’/all over public education/he’d hammer out data!/he’d hammer out logic!/he’d hammer out the relationship between poverty and learning a-all over this land…
Talk about a misuse of Occam’s Razor! Michael Petrilli establishes a hypothesis based on a statement made by Dennis Van Roekel –
“The United States’ standings haven’t improved dramatically because we as a nation haven’t addressed the main cause of our mediocre PISA performance — the effects of poverty on students,”
[In my mind this can be supported simply by looking at the average US PISA scores for students in schools at different levels of free and reduced lunch (poverty levels). These scores show obviously less poverty produces higher average scores!]
Michael Petrilli goes off on a tangent about Math scores vs other scores in an attempt to discredit Van Roekel’s statement! Does anyone see the word Math mentioned in Van Roekel’s statement? In trying to follow his illogical article, he seems to attempt to show that since US scores are lower in Math than the other scores, it must be something other than poverty? Now that is a s t r e t c h!
Reblogged this on Sustainable Education Transformation and commented:
Mike Petrilli’s argument that poverty has nothing to do with PISA scores get’s brilliantly hammered by Bruce Baker at School Finance 101.
OK, Results correlate with income. The question is whether or not public schools should be strategically driven to disrupt this correlation. Altruistically, in general direction, yes. Slavishly, by forcing changes to admission of outcomes, then no. If a school is expressly discriminating, then by all means hammer it. But if a school has an offering and all are welcome to apply but only non-low-income are interested then what to do? Look, I wish all people would make decisions the way I do, but bottom line is that they don’t. Be open to all, and let people choose. People may not choose in stoichiometric proportion to what I want, but no matter the result it is democratic. No like? Them educate the population.
No easy answers. But I will not surrender to the wrongheaded presumption that my desires are invalid or biased merely because my income is too high or too low.
Publius
Indeed, the goal is to leverage education policies to disrupt the relationship between income/poverty and outcomes. The problem is that the U.S. has been quite poor at leveraging the necessary resources to accomplish this goal, either in terms of providing sufficient broad based support for low income children (services beyond schooling) or in terms of targeted support for relevant educational interventions. See:
Coley, R., Baker, B.D. (2013) Poverty and Education: Finding the Way Forward. ETS Center for Research on Human Capital and Education. Princeton, NJ: Educational Testing Service http://www.ets.org/s/research/pdf/poverty_and_education_report.pdf
Baker, B.D., Sciarra, D., Farrie, D. (2012) Is School Funding Fair? Second Edition, June 2012. http://schoolfundingfairness.org/National_Report_Card_2012.pdf
Baker, B.D. (2012) Revisiting the Age Old Question: Does Money Matter in Education. Shanker Institute. http://www.shankerinstitute.org/images/doesmoneymatter_final.pdf
Baker, B.D., Corcoran, S.P.(2012) The Stealth Inequalities of School Funding: How Local Tax Systems and State Aid Formulas Undermine Equality. Washington, DC. Center for American Progress. http://www.americanprogress.org/wp-content/uploads/2012/09/StealthInequities.pdf
To the extent that we take the Petrillian angle here and simply ignore our lack of and declining investment in children and specifically lower income children (in states throwing their education systems under the bus) and suggest that this problem can be solved by making those math teachers teach better, or firing them based on test scores – we are unlikely to ever make sufficient progress. Poverty is a current, baseline condition of our system and a condition that substantively influences our starting point – substantively influences variation in student outcomes at large scale (between Mississippi and Massachusetts), medium scale (across schools and districts within states) and small scale (between lower and higher income kids within schools). We must be cognizant of and not totally ignore these current conditions as we craft policies to address these gaps.
Agree that US poverty rate helps explain why US average math scores are lower than we’d like them to be. But how do you explain why top US students (90th percentile) are rather below average when compared with top students (90th percentile) across the world? And the fact that performance of the 90th percentile in the US has declined over the past decade? Could it be that we need to change US math teaching practices and curriculum? http://bit.ly/1jNBLiw
This is certainly a concern. There has not in the U.S. been strong policy interest over time in how to best serve our most academically advanced students and in particular how to find and challenge academically advanced students from economically disadvantaged settings. I’ve written about this extensively in my academic work.
However, I would point out a few issues with the representation of the data in the post to which you refer. The post to which you refer compares the 90th percentile scores, among the score distribution itself, not relative to income/poverty. That is, it’s relative to the overall distribution, where the U.S. distribution & average is more dragged down by relative poverty. It would be more relevant – at least as an extension of my analysis, to compare students in comparable income brackets than to compare the 90th percentile scorers, because the 90th percentile scorers in the U.S. would still be at much lower average relative income than the 90th percentile scorers in a much lower poverty country.
See page 15, Table 6 which shows the PISA scores for U.S. schools by poverty rate (then compare to other countries).
http://nces.ed.gov/pubs2011/2011004.pdf [spoiler alert: kids in our low poverty schools score favorably when compared with top nations]
Second, the first several spots on that table are taken up by cities that are hardly legitimate comparisons to a national system.
Concurrently countering both of these issues, which really overlap, I suspect that the 90th percentile student in Massachusetts stacks up reasonably well.
Our BIG problem when viewed as a nation is that we have many, many states that drag down our entire country, that have very weak policy supports for children generally, for children in poverty (and their families) more specifically, and have provided very weak support for and more recently have pushed to deconstruct entirely their public education systems (the systems that still serve the vast majority of children). To the extent we as a country wish to continue to permit this level of state destruction of public education, then we will have to suck it up and deal with persistent child poverty and lagging short term and longer term outcomes for these children.