I’ve written a few posts in recent months where I’ve raised concern about the apparent complete disregard (& outright ignorance) for the role of equitable and adequate financing of our public schools. The bottom line is that providing for a high quality, equitably distributed system of public schooling in the United States requires equitable, adequate and stable and sustainable public financing. There’s no way around that. It’s a necessary underlying condition.
I too often here pundits spew the vacuous mantra – it doesn’t matter how much money you have – it matters more how you spend it. But if you don’t have it you can’t spend it. And, if everyone around you has far more than you, their spending behavior may just price you out of the market for the goods and services you need to provide (quality teachers being critically important, and locally competitive wages being necessary to recruit and retain quality teachers). How much money you have matters. How much money you have relative to others matters in the fluid, dynamic and very much relative world of school finance (and economics more broadly). Equitable and adequate funding matters.
But alas, it seems that one of the first things to go when the economy tanked a few years back was any sense that equity could ever be important. Take, for example, NY Governor Cuomo’s recent response to a challenge to racial disparities in funding shortfalls in his state.
Asked in a radio interview this morning about Schenectady Schools Superintendent Larry Spring joining those filing a federal civil rights complaint against the state alleging its school funding mechanism shortchanges minority students and those with disabilities, Gov. Cuomo didn’t so much answer the question as elaborately re-phrase it.
That’s called democracy, and that’s what the Legislature debates every year and what is the fair amount of funding for each district. And should a rich district get no money because they’re a richer district, or should they get more money because they put in more money? Should the needier districts get all the money because they’re needier even though they put in less? And that is the annual debate of the state budget and the education funding formula.
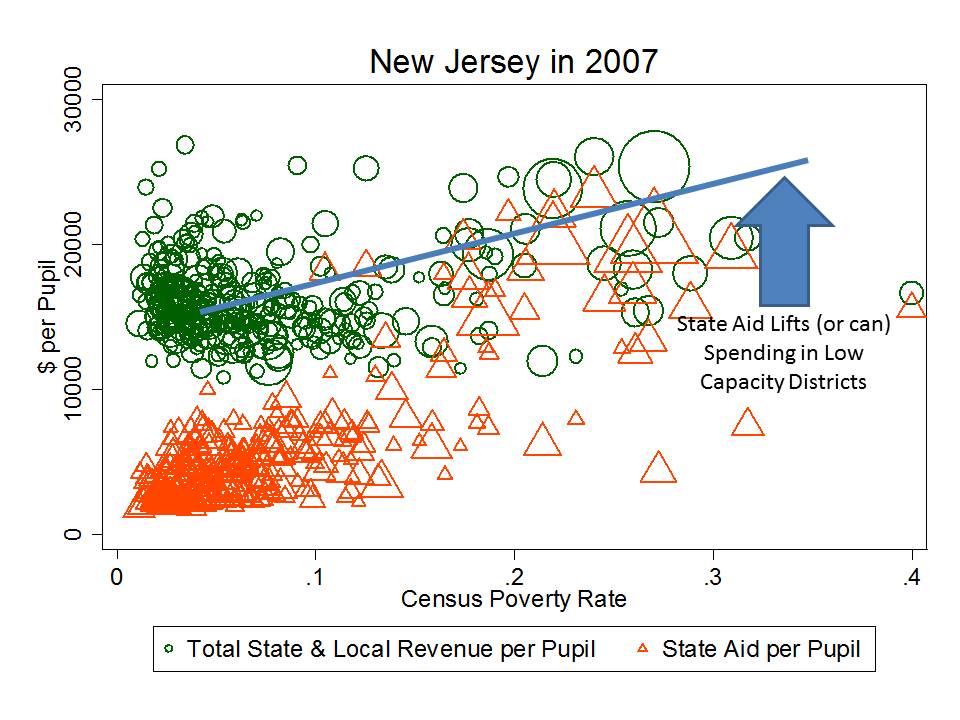
Over the past several weeks, as I embark on a new project evaluating the past 20 years of funding equity and funding level shifts across states, I’ve begun playing around with alternative ways to characterize changes to funding over time, and evaluate causes of those changes. I’ve explained in previous posts how the amount of total state aid, for example, is only part of puzzle. The extent to which state aid is targeted according to local fiscal capacity and need is most important for determining whether increased state aid will improve overall equity. For example, here’s New Jersey state aid per pupil and total state and local revenue per pupil in 1997 and again in 2007.
In 1997, districts with higher poverty rates were already receiving higher levels of state aid than their less needy counterparts. But the differences in aid were not sufficient to create an overall upward tilt – progressive pattern.
Figure 1 – NJ in 1997

By 2007, the infusion of state aid into high need districts had pushed those districts to a point where they were better positioned to provide smaller class sizes and to pay more competitive wages. The state aid had been sufficiently targeted to achieve an overall progressive distribution of state and local revenue.
Figure 2 – NJ in 2007
 What I’ve been working on lately, is tracking the relative progressiveness/regressiveness of state and local revenues and of state aid, over time from 1993 to 2011 for all states, using the same “fairness ratio” we use in our annual report on school funding fairness.
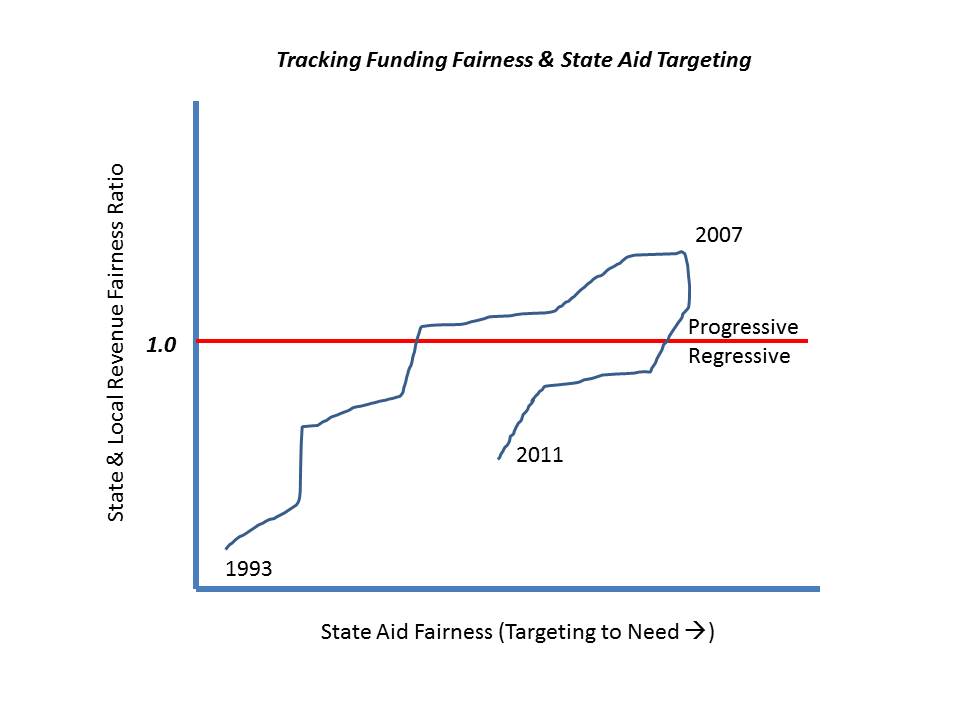
Imagine, for example, having a state and local revenue fairness indicator for every year, for each state, from 1993 to 2011.
- Where the index is 1.0, a district with 30% children in poverty (census poverty) is expected to have about the same state and local revenue per pupil as a district with 0% poverty.
- Where the index is 1.2, a district with 30% children in poverty is expected to have about 120% (20% more) revenue per pupil than a district with 0% poverty.
- And where the index is .8, a district with 30% poverty is expected to have about 80% of the revenue of a district with 0% poverty.
As in this hypothetical, one can track the changes in targeting of state aid along with the changes in overall state and local revenue fairness. Note that even if state aid fairness stays constant from one year to the next, changes in local revenue raising patterns can alter equity. Further, state aid might be allocated relatively “fairly” but at too low a level to improve overall state and local revenue equity.
In my forthcoming academic papers on this topic, models include multiple moving parts.
In this hypothetical, in 1993, state aid is poorly targeted according to needs but that targeting improves over time (moving to right) and as a result, state and local revenue fairness improves (moving up vertically). By 2007, the system reaches it’s peak of aid targeting and overall progressiveness. But then the system falls back as state aid targeting declines – perhaps as a function of disproportionate aid cuts to the neediest districts while holding harmless less needy districts.
Figure 3 – Hypothetical over Time
Well, that’s what it looks like in hypothetical land. Now how does this look for actual states? Let’s start with a few that have spent much of the period in the progressive funding zone, above the red horizontal line.
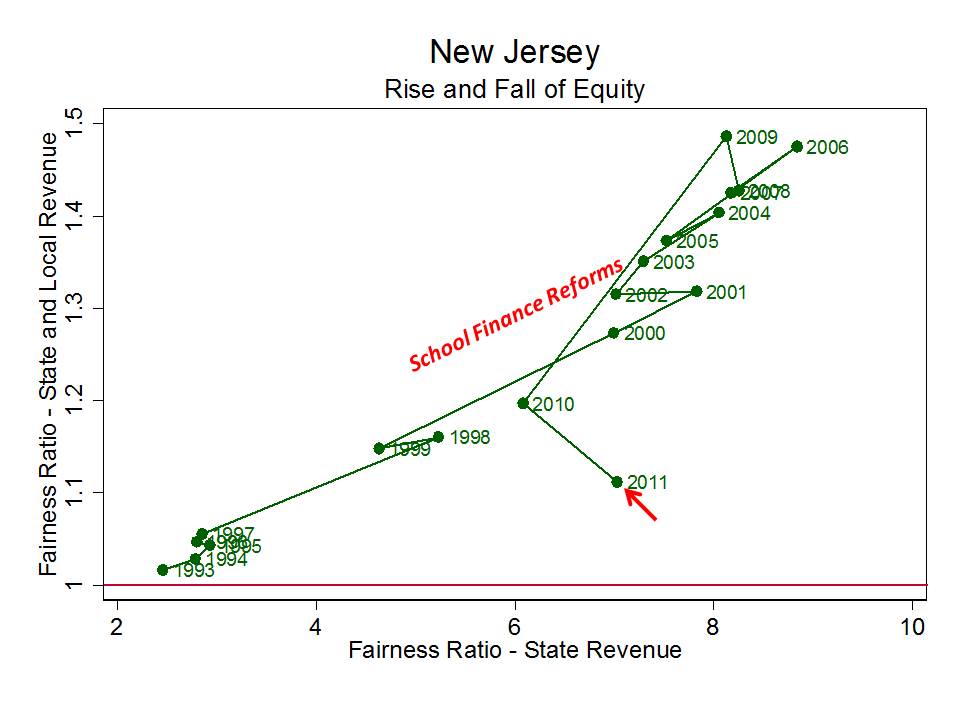
Each of these states reaches its peak around 2008 or 2009, then declines. New Jersey’s decline in aid targeting and overall progressiveness between 2009 and 2011 is particularly striking (at this point I’m waiting for the next year of data to see what’s going on here. Yes, it’s declined, but this seems more than expected).
Figure 4 – New Jersey
Massachusetts is a messier picture. School finance reforms in the early 1990s substantially shifted responsibility to the state (counterbalancing local revenue losses and emergent inequities from the 1980s in response to constitutional tax limits). Since that time, overall progressiveness has floated around between 1.2 and 1.4 and state aid fairness between 2.5 and 4.0. Overall progressiveness appears to peak twice in 2001 and again in 2008.
Notably, Massachusetts was among those states that took a pretty hard economic hit in the 2001-2003 economic slowdown (where states that had the largest share of income derived from investments/non-wage income seemed to suffer most). By 2011, however, Massachusetts is about as low on overall progressiveness as it has been since implementing school finance reforms in the 1990s.
Figure 5 – Massachusetts

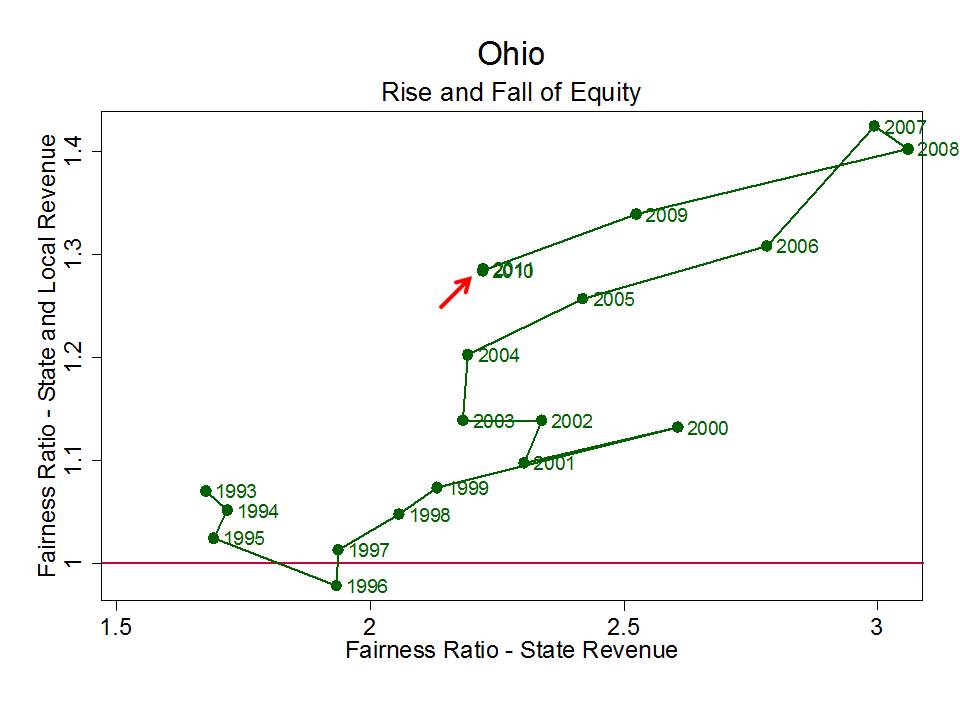
Ohio’s story is similar. Ohio was under judicial pressure throughout the 1990s (DeRolph cases) and is often characterized as being relatively non-responsive to that pressure. But Ohio did improve its overall progressive and its state aid targeting throughout that period, reaching a peak around 2007/08. But, then, like others, declining state aid targeting set the state back quite significantly (though 2010 and 2011 stay about the same).
Figure 6 – Ohio
 Connecticut really never implemented any systematic statewide school finance reform (maintaining variations on the Education Cost Sharing Formula since the mid 1990s). But Connecticut did over time allocate substantial lumps of aid to Hartford and New Haven for their magnet school programs, creating an appearance of a progressive statewide system. That system reaches its peak of progressiveness (leaving out many other high need districts) at a few points in the 2000s (2000, 2001, 2008, 2002) and peak of targeting in 2007, then, like others declines quite substantially – ending at flat funding.
Figure 7 – Connecticut

Figure 8 – Kansas
 Kansas is a fun case that begins with adoption of a new weighted funding formula coupled with spending/revenue limits at the outset of the data. changes to local property taxation and shifting state aid lead to a rather jumbled mess of persistent regressiveness through the early to mid 1990s. In the later 1990s, legislators imposed cuts to local revenue requirements and then in 2001, state aid freezes and cuts let to a system that became more and more regressive, despite marginally better aid targeting, reaching its low in 2004. At this point, judicial pressure (2003) kicks in, followed by a high court ruling (2006) accepting reform legislation which temporarily drives Kansas school funding into the progressive zone. But that doesn’t last long, and by 2011, Kansas finds itself back in regressive territory, similar to year 2000 levels.
And now for the states that have never even come close to cracking the progressive threshold even with reforms (Pennsylvania) and judicial pressure (New York).
Figure 9 – New York
 New York did make progress over time, and implementing a new funding formula after the Campaign for Fiscal Equity ruling did make some difference on state aid targeting. But that targeting has declined with steep aid cuts to needy districts.
Figure 10 – Pennsylvania
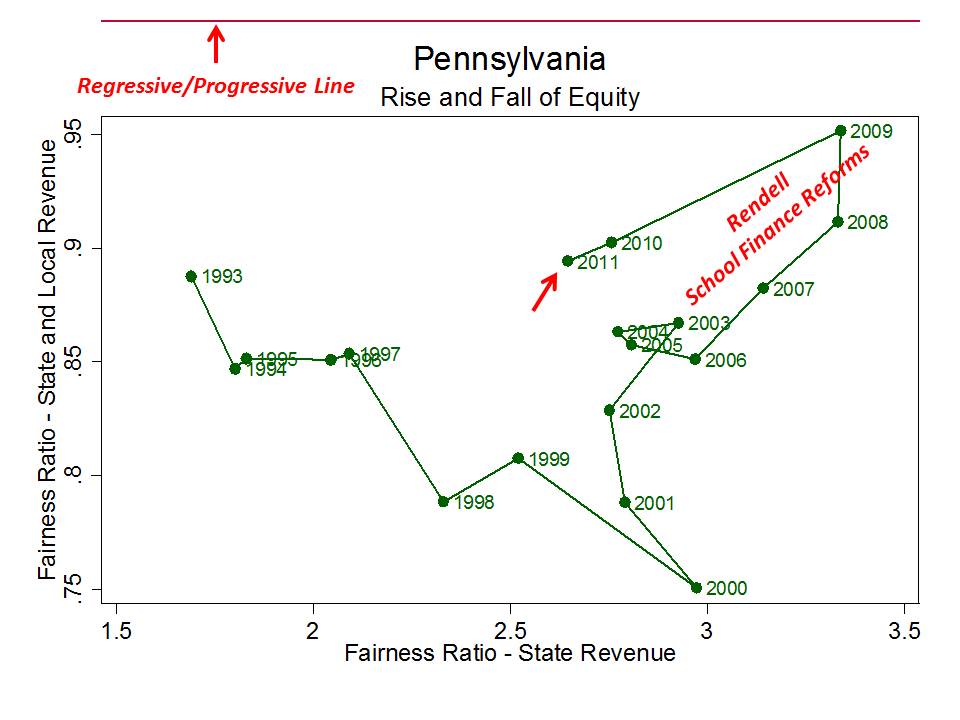
Pennsylvania had a fleeting moment in the late 200s where targeting of aid, and overall equity improved, but they’ve now reverted to regressiveness levels comparable to 1993.
Finally, Illinois never has, and perhaps never will really give a damn.
Figure 11 – Illinois
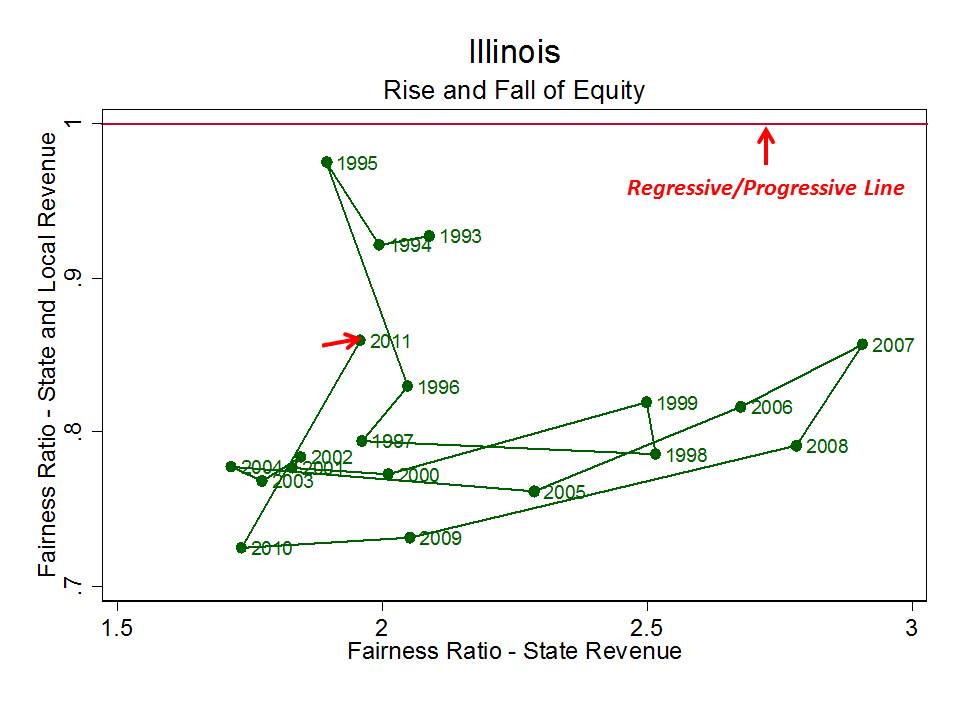 Aid became marginally more targeted around 2006-2009, but by 2011, Illinois aid is about as targeted as it was in the early 1990s and the system remains even more regressive than it was during that time period.
And yet we wonder why our lower income children’s educational outcomes continue to suffer? We pretend that if only our higher poverty districts would fire that bottom 5% of teachers who produce bad test scores (gains), they’d do better (because of course, they can hire a new crop of better teachers even if they can’t pay a competitive wage?). We pretend that expanding charter schooling, to siphon off the less needy among the needy into privately subsidized (soft money) schools (and diminished legal protections) that somehow we’ll achieve a desirable systemwide effect?
We continue to place risky bets on not only revenue neutral, but revenue negative “solutions.” But hey, those are other people’s children anyway, right?
Meanwhile, the damage that’s been done to our public education systems by outright and at times belligerent neglect of state school finance systems has, in the past 3 years alone set us back in many cases 20 years.
Now is the time to turn that corner and attempt to repair that damage as quickly as it was inflicted.

Excellent work as usual! What data would you need to produce a comparable chart for Maine?
[For starters, see:
http://mdischools.net/20130116_Rier_Education-Funding-Law-Implementation-graphic_1024x743.png%5D
Maine just kind of jumps around in the regressive space, without a whole lot of variation in state aid distribution. Jumps just over regressive line in 2010, then back below for 2011.
Thanks, Bruce! As you may know, we in the Maine legislature just commissioned a report from Larry Picus which concludes that Maine doesn’t do that badly compared to other states for equity between districts — but that we still probably underfund the economically disadvantaged statewide. Trickier because number of disadvantaged students may not directly correlate with district property wealth.
Complicating the data in NYS is the Big Five, or five urban school districts that do not have a separate school tax. In Buffalo, the city continues to give less of a percentage of tax revenues towards the schools, so most of the funding comes from the state. Due to the City Control Board, it has been over ten years since the teachers in Buffalo have seen a raise (other than step increases) and the three year wage freeze also damaged the salary scale (I never made it to the top step even after twenty nine years in the Buffalo Schools).
It would be interesting to see a graph of funding for Buffalo compared to the other four cities, as well as NYC. Buffalo has close to a billion dollar budget, but never seems to have enough to cover the extras, such as a much needed after school program. Staffing has been cut to the bone, so novelties such as computer teachers, full time librarians, and instrumental teachers, readily available in the suburbs, are a luxury. High school electives are limited.
Some things are hard to document, but these graphs are a good start.
I address this issue – fiscal dependence (on city/municipality) – and how it may contribute to inequity in a forthcoming report for Center for American Progress.
Thank you for looking into this issue. I find your discoveries fascinating.
Reblogged this on New Jersey Parent Advocates.
I am very interested in this subject. I am in California and work in the building products industry for schools. The highest grossing regions in the USA for my industry are always Kansas and Texas. Highly disproportionate with population. I am convinced it has to do with how funding is allocated. I would like to see this chart for California or is it impossible because of our Prop 13 situation?
construction funding is handled differently… and only some states provide state aid for school facilities construction (offsetting bond interest payments, etc). Kansas introduced such aid in the 1990s, leading to a clearing of backlog of many construction projects. I suspect that construction/deferred maintenance spending at the state aggregate level is a combined function of fiscal capacity to support construction coupled with population growth and demand for expanded and new facilities. Kansas hasn’t necessarily seen aggregate growth, but it has seen population shift to the KC metro with significant suburban sprawl and facilities expansion. Some of the school architectural firms in the KC area can give you insights on how the differences in KC and MO policies, including funding sources, affect their projects. I used to have a guy named Kirk Horner from Hollis and Miller come and talk to my classes in KS (for future administrators).
I think its really important as you look at funding equity to look as well at cost differentials. Before the 1990’s, the mission of education was focused on delivery of instruction. We provided time in a seat. We expected different students to respond to the instruction differently, but it was the student’s responsibility to take advantage of the seat time offered. Under this system, each student cost the same, because we weren’t selling results, we were selling time in a seat in the classroom. There’s an excellent analysis of this point in the McCleary case dealing with equitable funding in the State of Washington.
Starting in the 1990’s (and earlier in special education under IDEA), the mission of education was redefined so as to require the delivery of all students to proficiency. Students coming to school start with significantly different levels of readiness, of intellect, of family support, and of interest. Delivering a child who comes to school one or two standard deviations behind the norm to proficiency costs significantly more than doing that with a student who starts out ahead. And school districts have significant differences in the percentage of cheap students and expensive students. Almost everywhere, legislatures fail to account for these differences.
Now that we are penalizing school districts for having low rates of proficiency, we are pushing them more and more to put significant resources into trying to catch students up. If they do that, in a competitive environment, they risk losing the cheap students. And it is generally the cheap students who have the resources and the family support to migrate to school districts who can afford to provide attractive programs for students who do well. This combination, of school competition, differential cost funding, and the intentional underfunding of mandatory programs for expensive students, is a central issue facing public education today. (Thanks by the way to the contribution you are making to these important issues)
Bruce, you may find a lot of helpful information about MN school funding over the past 20 years from Parents United. I hope it helps in your work on funding across states: http://www.parentsunited.org/school-funding/
Reblogged this on aureliomontemayor and commented:
The inequity in funding of our schools is the scandal of this and the previous century.