I have spent much time criticizing New Jersey’s Student Growth Percentile measures over the past few years, both conceptually and statistically. So why stop now.
We have been told over and over again by the Commissioner and his minions that New Jersey’s SGPs take fully into account student backgrounds by accounting for each student’s initial score and comparing students against others with similar starting point. I have explained over and over again that just because individual student’s growth percentiles are estimated relative to others with similar starting points by no means validates that classroom median growth percentiles or school median growth percentiles are by any stretch of the imagination a non-biased measure of teacher or school quality.
The assumption is conceptually wrong and it is statistically false! New Jersey’s growth percentile measures are NOT a valid indicator of school or teacher quality [or even school or teacher effect on student test score change from time 1 to time 2], plain and simple. Adding a second year of data to the mix reinforces my previous conclusions.
Now that we have a second year of publicly available school aggregate growth percentile measures, we can ask a few very simple questions. Specifically, we can ask how stable, or how well correlated those school level SGPs are from one year to the next, across all the same schools?
I’ve explained previously, however, that stability of these measures over time may actually reflect more bad than good. It may simply be that the SGPs stay relatively stable from one year of the next because they are picking up factors such as the persistent influence of child poverty, effects of being clustered with higher or lower performing classmates/schoolmates, or that the underlying test scales simply allow for either higher or lower performing students to achieve greater gains.
That is, SPGs might be stable merely because of stable bias! If that is indeed the case, it would be particularly foolish to base significant policy determinations on these measures.
Let’s clarify this using the research terms “reliability” and “validity.”
- Validity means that a measure measures what is intended to, which in this case, is that the measure is intended to capture the influence of schools and teachers on changes in student test scores over time. That is, the measure is not simply capturing something else. Validity is presumed good, but only to the extent those choosing what to measure are making good choices. One might, for example, choose to, and fully accomplish measurement of something totally useless (one can debate the value of measuring differences over time in reading and math scores as representative more broadly of teacher or school quality).
- Reliability means that a measure is consistent over time, presumed to mean that it is consistently capturing something over time. Too many casual readers of research and users of these terms assume reliability is inherently good. That a reliable measure is always a good measure. That is not the case if the measure is reliable simply because it is consistently measuring the wrong thing. A measure can quite easily be reliably invalid.
So, let’s ask ourselves a few really simple empirical questions using last year’s and this year’s SGP data, and a few other easily accessible measures like average proficiency rates and school rates of children qualified for free lunch (low income).
- How stable are NJ’s school level SGPs from year 1 to year 2?
- If they are stable, or reasonably correlated, might it be because they are correlated to other stuff?
- Average prior performance levels?
- School level student population characteristics?
If we were seeking a non-biased and stable measure of school or teacher effectiveness, we would expect to find a high correlation from one year to the next on the SGPs, coupled with low correlations between those SGPs and other measures like prior average performance or low income concentrations.
By contrast, if we find relatively high year over year correlation for our SGPS but also find that the SGPS on average over the years are correlated with other stuff (average performance levels and low income concentrations), then it becomes far more likely that the stability we are seeing is “bad” stability (false signal or bias) rather than “good” stability (true signal of teacher or school quality).
That is, we are consistently mis-classifying schools (and by extension their teachers) as good or bad, simply because of the children they serve!
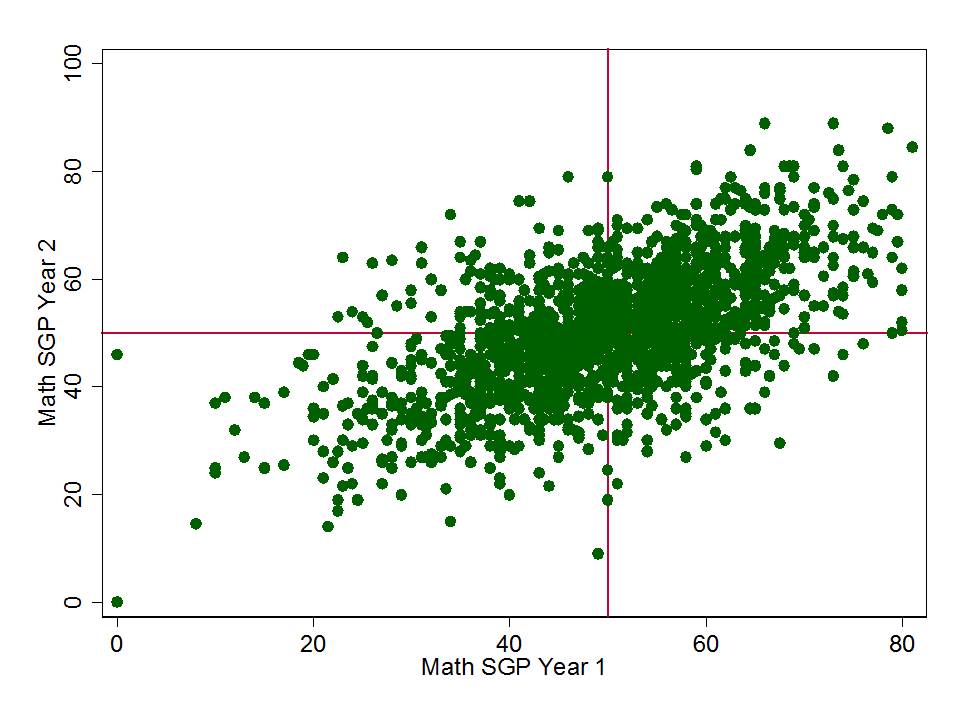
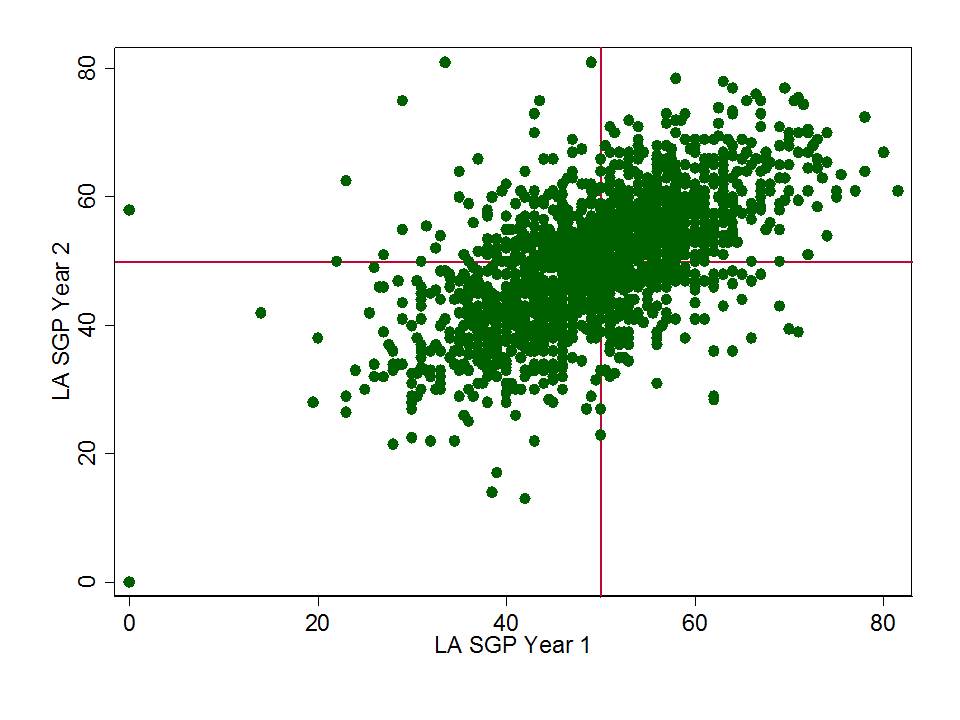
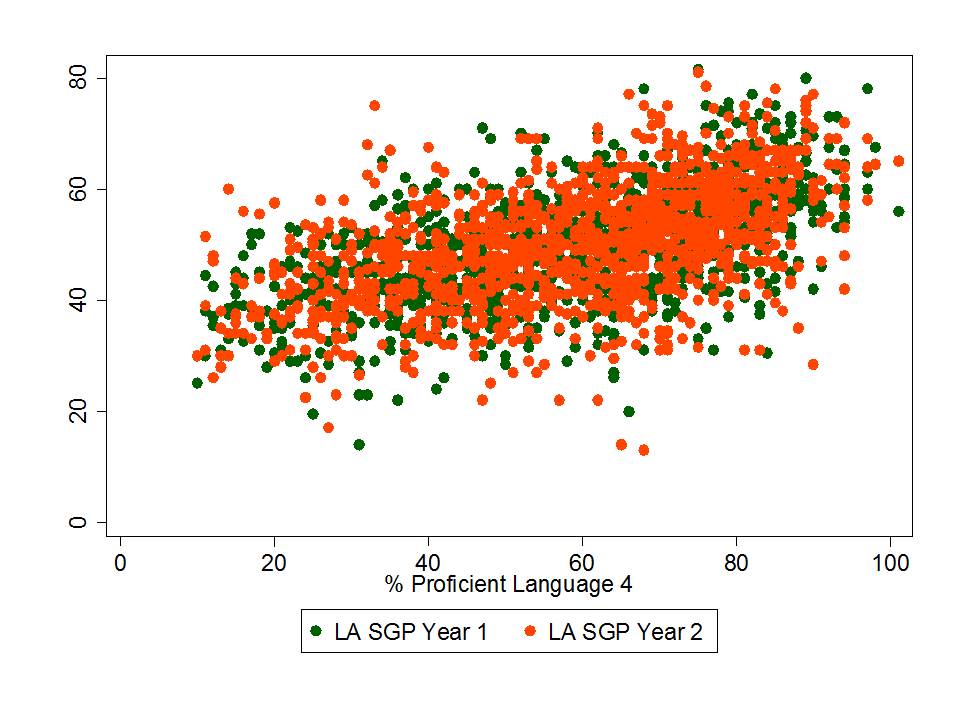
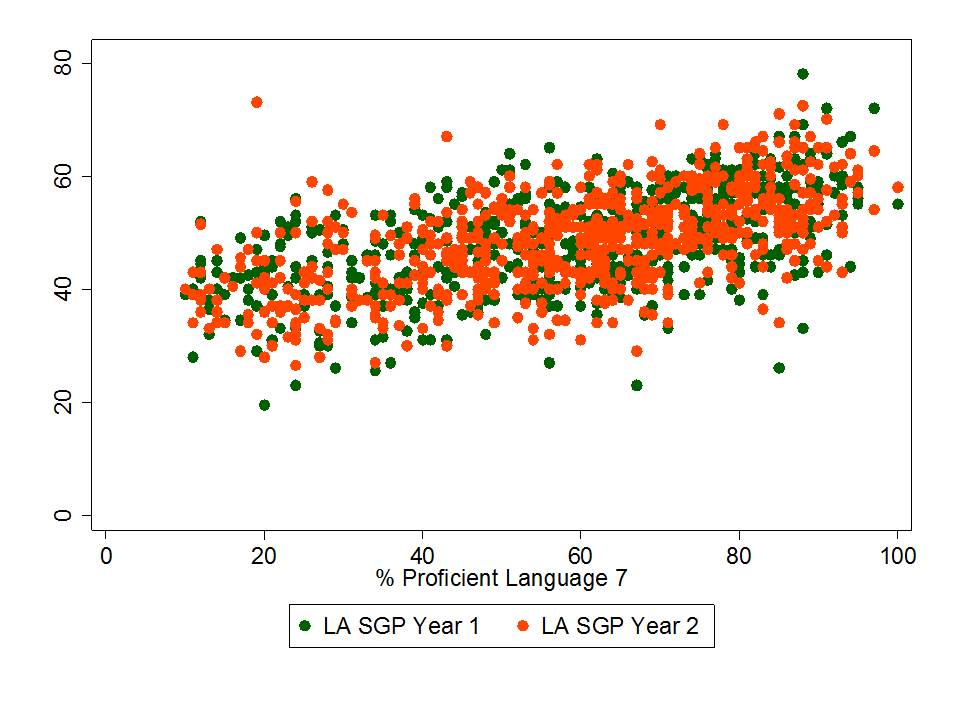
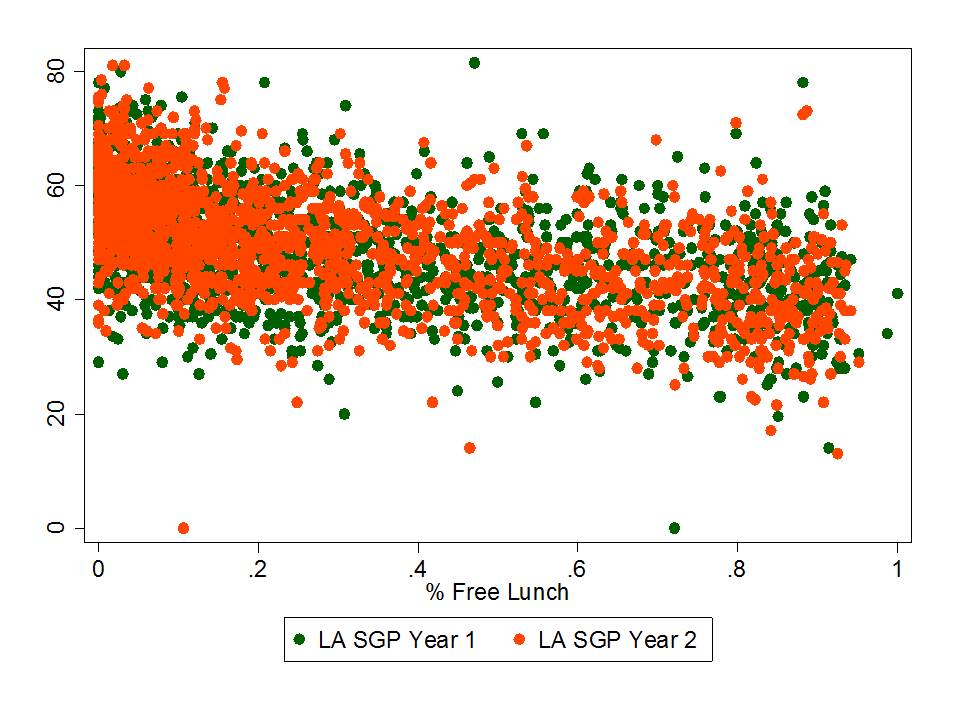
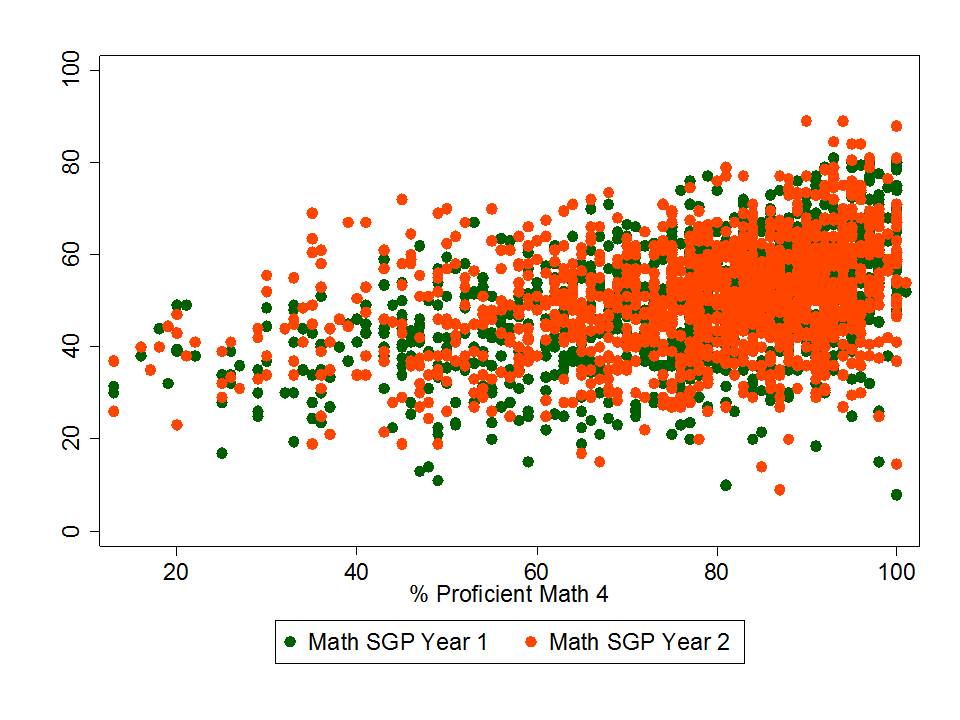
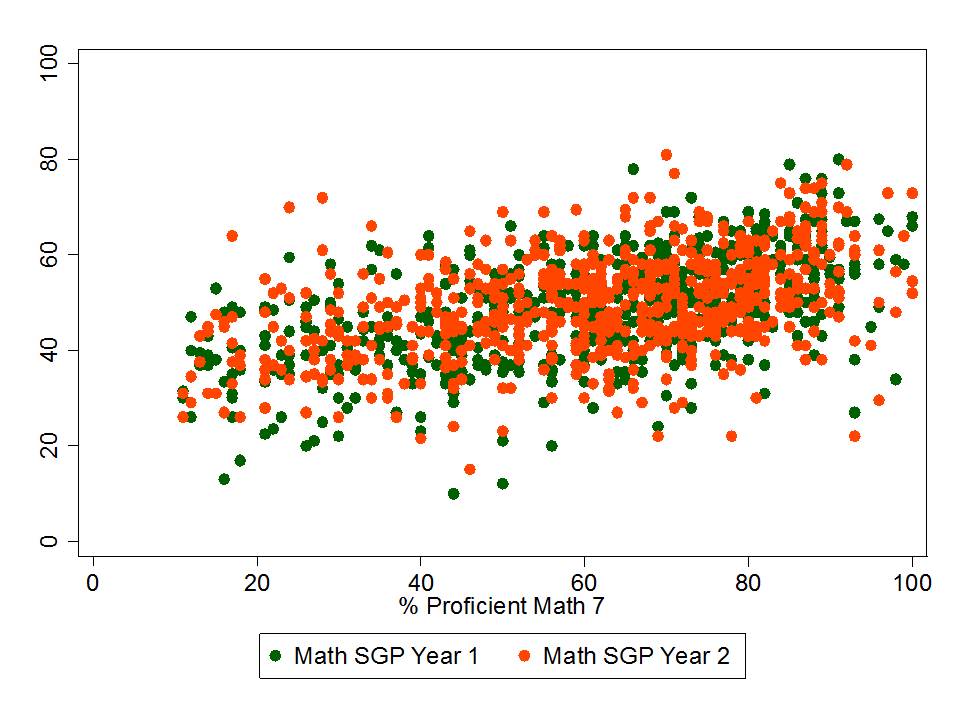
Well then, here’s the correlation matrix (scatterplots below):

The bottom line is that New Jersey’s language arts SGPs are:
- Nearly as strongly (when averaged over two years) correlated with concentrations of low income children as they are with themselves over time!
- As strongly (when averaged over two years) correlated with prior average performance than they are with themselves over time!
Patterns are similar for math. Year over year correlations for math (.61) are somewhat stronger than correlations between math SGPs and performance levels (.45 to .53) or low income concentration (-.38). But, correlations with performance levels and low income concentrations remain unacceptably high – signalling substantial bias.
The alternative explanation is to buy into the party line that what we are really seeing here is the distribution of teaching talent across New Jersey schools. Lower poverty schools simply have the better teachers. And thus, those teachers must have been produced by the better colleges/universities.
Therefore, we should build all future policies around these ever-so-logical, unquestionably valid findings. That the teachers in high poverty schools whose children had initially lower performance and thus systematically lower SGPs, must be fired and a new batch brought in to replace them. Heck, if the new batch of teachers is even average (like teachers in schools of average poverty and average prior scores), then they can lift those SGPs and average scores of high poverty below average schools toward the average.
At the same time, we must track down the colleges of education responsible for producing those teachers in high poverty schools who failed their students so miserably and we must impose strict sanctions on those colleges.
That’ll work, right? No perverse incentives here? Especially since we are so confident in the validity of these measures?
Nothing can go wrong with this plan, right?
A vote of no confidence is long overdue here!


There is such a high correlation between schools Math SGPs and LA SGPs, the cause of which must be something other than individual Teacher effects, unless one is to assume that abilities of all Math and English Teacher within the same school are highly correlated.
Indeed that correlation is also suggestive that the SGPs are really capturing something about the group of kids (contextual factors) and not their teachers…
I agree that these measures are more or less useless for evaluation purposes. I am interested, though, in how percentile rankings change over time for students or groups of students. Do the higher poverty students fall further behind in the sense that their percentile ranking drops over time as they are “passed up” by lower poverty students? Do you have any research on this?
I looked at NAEP data by quartile and poverty level (FRPL), and the higher poverty students do not appear to fall further behind as far as rank order goes. Back of the envelope calculations seem to show the same thing for Massachusetts MCAS scores.
That math and language arts scores correlate isn’t surprising to those of us who have taught both subjects, particularly to younger children, which for me meant grades 4, 6, 7, 8. Some research done by one of my grad students looked at correlations among grade 7 and 8l New York language arts and math tests and their respective California Achievement Tests. The highest correlation to the grade 8 math score was the grade 8 ELA score, followed by the grade 7 math score. CAT math scores came in 3rd. In my experience, students who are good at one subject tend to be pretty good across the board in early grades and middle school. It is the exception among young children to be good at math and bad at English, or vice versa. Bigger differences begin to show up in higher grades, where divergence of language abilities and math or science abilities are more noticeable, but again, I think this is student interest as much as capability. A look at individual student math and verbal SAT scores will also show that success in one area tends to be repeated with success in the other–well above average in math is likely to also be at least above average in verbal. The single subject aptitude child is the exception rather than the rule.
Referencing your comment on validity of SGP methodology:
“Validity means that a measure measures what is intended to, which in this case, is that the measure is intended to capture the influence of schools and teachers on changes in student test scores over time. That is, the measure is not simply capturing something else. Validity is presumed good, but only to the extent those choosing what to measure are making good choices. One might, for example, choose to, and fully accomplish measurement of something totally useless (one can debate the value of measuring differences over time in reading and math scores as representative more broadly of teacher or school quality).”
I’ve been reading a few of the published (and in-press) papers on SGPs and one of the understandings I have gained is that SGPs were not even designed to measure the thing(s) that they’re currently being used to measure, i.e., the influence of schools and teachers on student performance.
So, isn’t this almost a moot point?
You are absolutely correct, and that’s a point I make in the video. SGPS aren’t even designed for this. But sadly, it seems I still have to show how bad they are when used this way… because state officials are determined to continue down this path.
Reblogged this on New Jersey Parent Advocates.