This week started with several individuals from the Washington DC area asking if I would address a school closure/turnaround report produced by an outside consulting firm on contract with the DC Public Schools (as I understand it). That consulting firm basically made a map of the locations of the schools around the city, identified which schools had higher and lower proficiency rates, and where proficiency rates had changed over time, and then basically listed the lowest performing schools by these deeply flawed metrics suggesting their closure and alternatives for “turnaround,” essentially focusing on conversion and expansion of charter schools. Thankfully, before I even got a chance to dig into the report, two other bloggers took it to task. As Steve Glazerman explains here:
Student proficiency rates have long been discredited as a school performance measure because proficiency rates capture student achievement at a point in time, but say little about how much the school or its teachers contributed to its current students’ performance.
For example, a middle school could have declining proficiency rates if a feeder school begins sending more at-risk students to it, even if the teachers are especially skilled at working with a challenging population.
At a bare minimum, a sensible measure accounts for what a student knew before enrolling in the school (for example, using the student’s score from the prior year). This is why more and more states, including DC, have adopted student achievement growth measures instead of proficiency rates for their teacher and school performance indicators.
Using a trend in proficiency rates doesn’t help, and only creates a false sense of “gains” which is more likely to measure demographic change and other differences between successive cohorts of students cycling through a school than the performance of the schools’ educators. That’s because it compares students in one year to different students, instead of students in one year to the same students in the prior year.
By relying on flawed measures of school performance, policymakers risk closing down schools that are best equipped to work with challenging populations and replacing them with ones that would fail miserably if they started working with a different student body.
http://greatergreaterwashington.org/post/13512/flawed-study-mis-rates-potential-dc-school-closings/
Matt Di Carlo also addressed the issue of conflating student and school performance here.
This early-in-the-week flap brought back to mind an even more crude, sloppy and egregiously flawed report that was produced last spring for Newark Public Schools by a group calling itself Global Education Advisors. Here’s a story about the report. http://www.njspotlight.com/stories/11/0607/2319/. And here’s a link to what they produced: http://www.njspotlight.com/assets/11/0306/2157
Let’s be really blunt/honest here. This stuff is hack junk, and whoever is responsible for producing it really has no business providing recommendations on anything relating to schools/education, or for that matter the basic use/presentation of data.
Because I didn’t take this report seriously at all at the time, I totally blew it off. After all, who would really make decisions affecting large numbers of low income urban schoolchildren based on such ill-conceived schlock. At least the shoddy analyses produced by the Pittsburgh based group working for Washington DC kind of looked serious.
Note that on Page 6 of the Newark report, the authors suggest that charter schools be moved into several NPS school locations including MLK, Burnet and Eighteenth Avenue. This recommendation appears in part based on the authors’ identification of “low performing schools” shown in appendices at the end of the document. The third slide from the end simply sorts schools from highest to lowest proficiency rates to identify the lowest performing quintile from 2009: http://www.njspotlight.com/assets/11/0306/2157
And perhaps none of this schlock really does enter into the current discussions on Newark school closures. One can only hope.
In any case, yesterday’s Star Ledger included a story on proposed school closures and reorganization in Newark. http://www.nj.com/news/index.ssf/2012/02/newark_superintendent_to_annou.html
Let me start by saying that I do like some of the language/explanations being used by the Superintendent in explaining her desire to look at the system as a whole – including charter, magnet and traditional public schools – and how they each affect one another in terms of how children are distributed across those schools.
Let me also be clear that I’m all for within district school reorganization especially to optimize the efficiency of school district operations and achieve more balanced student populations across schools. Very small schools operating within population dense urban districts are a resource drain. By very small, I mean elementary schools of less than 300 students, or high schools of less than 600 students. Subsidizing very small schools’ operations necessarily takes away from other things. Also, concentrated poverty – high concentrations of children from very low income families – is very hard to overcome, as is racial isolation in schools. To the extent that school districts can better distribute/balance/integrate populations, improving outcomes can be easier. This stuff should be considered/on the table. Just to be clear, I’m all for appropriate re-organization.
What I’m not for… and I’m not yet sure what’s going on here… is pretending that we can simply shut down schools in high poverty neighborhoods, blaming teachers and principals for their failure, and then either a) replacing the school management and staff with individuals likely to be even less qualified and less well equipped to handle the circumstances, or b) initiating an inevitably continuous pattern of displacement from school to school to school for children already disadvantaged.
Again, I don’t yet see this kind of language being used in Newark, as it has been in New York City, for example (regarding the 33 “low performers” there).
But, let’s take a quick look at the schools which the Ledger reports as being on the closure hit list: “Dayton Street, Martin Luther King, 18th Avenue, Miller Street and Burnet Street elementary schools”
Some of these schools also made the Global Education Advisors hit list, including Burnett, MLK and Eighteenth Ave.
First, here’s where the schools fit in a districtwide/citywide sort of % Free Lunch (2011):
 Closure elementary schools are indicated in Red, and charter schools in Green. District average (labeled Total – sorry) is in Black. In short, these are high poverty schools, with two of them – Dayton and Miller St having among the highest concentrations of low income children.
Now, here’s how they perform on a few select tests, with the schools sorted by low income concentration and proficiency based on 2010 assessment data (General Test Takers):


In brief, they perform pretty much where you’d expect them to, with Burnett and Miller outperforming similarly low income schools in Math, with Dayton well below the trendline, and with Burnet falling down with Dayton on Language. But again these schools still fall near other similar schools.
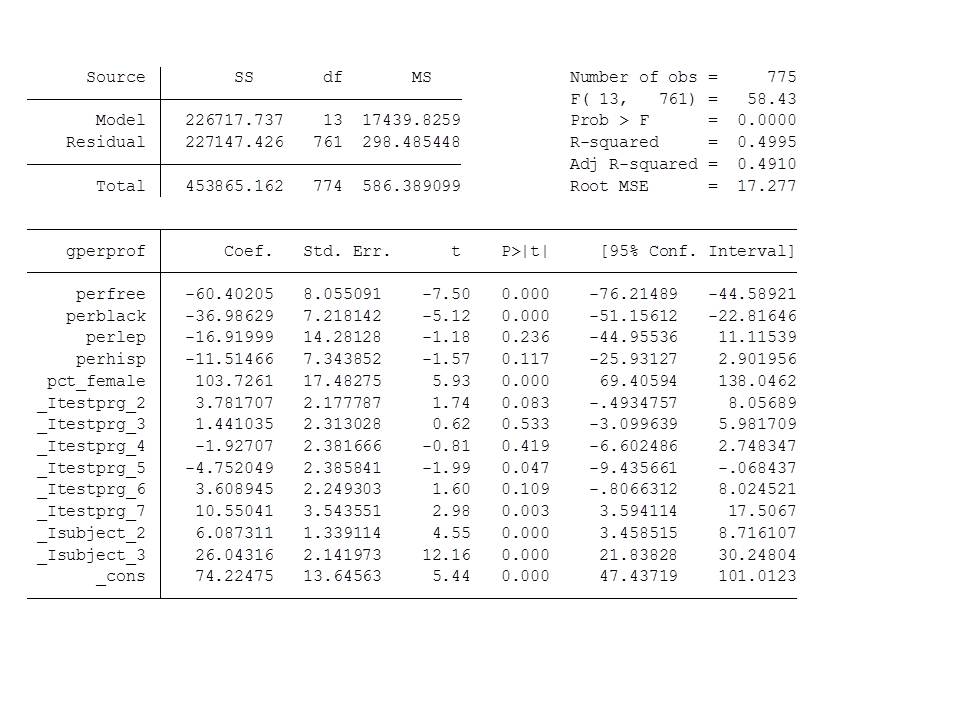
Low income concentration alone isn’t the only reasonable predictor of performance differences across theses schools, and it’s useful to be able to bring in – aggregate – results across all of the tests and grade levels. So, I ran a quick & dirty descriptive regression model in which I predicted general test taker proficiency rates accounting for a) % Free lunch b) % by racial composition (Black/Hispanic) c) % LEP/ELL, d) % Female (strong predictor w/NJ scores in urban contexts). And, I control for which test/grade level. Here’s a link to the output.
Then, for visual fun, I plotted the differences (standard deviations) between expected and actual performance for 2010 assessments… here:
 So, what we have here is a mix of Newark schools much like other Newark schools which are very high in poverty. They have a mix of student outcomes, some beating expectations and others falling short, and they have a mix in terms of specific grade levels and assessments.
And notice the green dots in the picture – those charter schools. All of those charter schools serve substantively less poor populations than the NPS schools identified by the Ledger for closure. And some of those charter schools actually fall further below their “expected” performance levels than the worst of the NPS schools slated for closure.
Let’s be absolutely clear here – these high poverty schools slated for closure (if the Ledger is correct) – cannot simply be converted into lower poverty schools and made “more successful.”
Indeed redistributing those students among less poor students – altering the peer composition by disrupting concentrated poverty might help. But there aren’t a whole lot of options available for accomplishing that. Further, with each disruptive relocation for each child comes another potential marginal loss.
Let’s just hope those involved are being somewhat more thoughtful about these decisions and using more reasonable information to guide their decision making that what was produced for the district last spring, or that which stirred up such controversy in DC earlier this week.
UPDATE:
Here are some maps of the above data. First, here are the schools in Newark, with the regression based relative performance estimates from the last figure above. Schools in blue perform above expectations (based on proficiency rates) and schools in red below expectations. Schools with a push-pin in them are charter schools and schools with a red X are elementary schools slated for closure. As in the above pictures (because it’s the same data), those slated for closure include a mix of higher and lower performing schools. Similarly, charter schools are a mixed bag. Note that the locations of the schools are determined using the latitude and longitude data from the NCES Common Core, which by my experience, may include some errors (school locations may be incorrectly or imprecisely reported).
 Here’s what it looks like with the schools shaded according to % free lunch. Schools slated for closure are invariably among the highest poverty schools. The difficulty here is that other NPS schools around them also tend to be very high poverty, while nearby charter schools have much… much… much lower poverty concentrations.


Nice work!
Global Advisors? Isn’t that the firm Cerf set up out of his house but had no interest in?
http://www.nj.com/news/index.ssf/2011/02/acting_nj_education_chief_cerf.html There is an article about Cerf’s ties to GEA.
I find it interesting that according to the SL, spokeswoman Erica Lepping,said ” the audit was not intended to make recommendations, just assert facts.”. Yet, the Global Advisors report that you noted, is simply their recommendations or maybe Cerf’s?