In case you hadn’t noticed evidence is mounting of a massive value-added and growth score train wreck. I’ve pointed out previously on this blog that there exist some pretty substantial differences in the models and estimates of teacher and school effectiveness being developed in practice across states for actual use in rating, ranking, tenuring and firing teachers – and rating teacher prep programs – versus the models and data that have been used in high profile research studies. This is not to suggest that the models and data used in high profile research studies are ready for prime time in high stakes personnel decisions. They are not. They reveal numerous problems of their own. But many if not most well-estimated, carefully vetted value-added models used in research studies a) test alternative specifications including use of additional covariates at the classroom and school level, or include various “fixed effects” to better wash away potential bias and b) through this process, end up using substantially reduced samples of teachers for whom data on substantial samples of students across multiple sections/classes within year and across years are available (see, for example: http://nepc.colorado.edu/files/NEPC-RB-LAT-VAM_0.pdf ). Constraints imposed in research to achieve higher quality analyses often result in loss of large numbers of cases, and result potentially in clearer findings, which makes similar approaches infeasible where the goal is not to produce the most valid research but instead to evaluate the largest possible number of teachers or principals (where seemingly, validity should be an even greater concern).
Notably, even where these far cleaner data and far richer models are applied, critical evaluators of the research on the usefulness of these value-added models suggest that… well… there’s just not much there.
Haertel:
My first conclusion should come as no surprise: Teacher VAM scores should emphatically not be included as a substantial factor with a fixed weight in consequential teacher personnel decisions. The information they provide is simply not good enough to use in that way. It is not just that the information is noisy. Much more serious is the fact that the scores may be systematically biased for some teachers and against others… (p. 23)
Rothstein on Gates MET:
Hence, while the report’s conclusion that teachers who perform well on one measure “tend to” do well on the other is technically correct, the tendency is shockingly weak. As discussed below (and in contrast to many media summaries of the MET study), this important result casts substantial doubt on the utility of student test score gains as a measure of teacher effectiveness.
A really, really, important point to realize is that the models that are actually being developed, estimated and potentially used by states and local public school districts for such purposes as determining which teachers get tenure, or determining teacher bonuses or salaries, who gets fired… or even which teacher preparation institutions get to keep their accreditation?…. those models increasingly appear to be complete junk!
Let’s review what we now know about a handful of them:
New York City
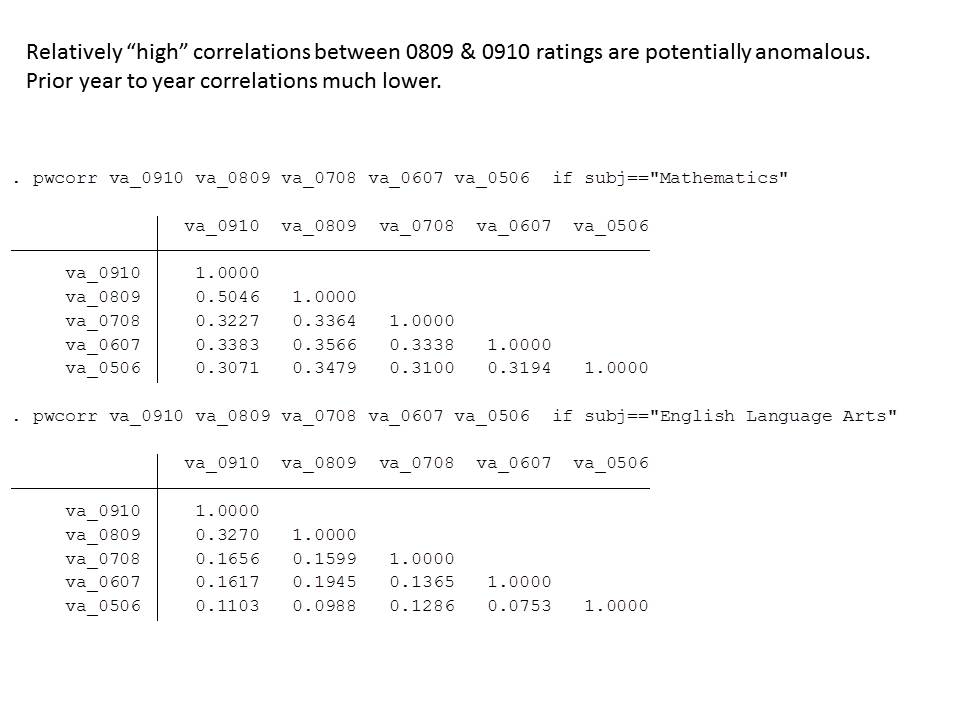
I looked at New York City value-added findings when the teacher data were released a few years back. I would argue that the New York City model is probably better than most I’ve seen thus far and its technical documentation reveals more thorough attempts to resolve common concerns about bias. Yet, the model, by my cursory analysis still fails to produce sufficiently high quality information for confidently judging teacher effectiveness.
Among other things, I found that only in the most recent year, were the year over year correlations even modest, and the numbers of teachers in the top 20% for multiple years running astoundingly low. Here’s a quick summary of a few previous posts:
Math – Likelihood of being labeled “good”
- 15% less likely to be good in school with higher attendance rate
- 7.3% less likely to be good for each 1 student increase in school average class size
- 6.5% more likely to be good for each additional 1% proficient in Math
Math – Likelihood of being repeatedly labeled “good”
- 19% less likely to be sequentially good in school with higher attendance rate (gr 4 to 8)
- 6% less likely to be sequentially good in school with 1 additional student per class (gr 4 to 8)
- 7.9% more likely to be sequentially good in school with 1% higher math proficiency rate.
Math [flipping the outcome measure] – Likelihood of being labeled “bad”
- 14% more likely to be bad in school with higher attendance rate.
- 7.9% more likely to be sequentially bad for each additional student in average class size (gr 4 to 8)
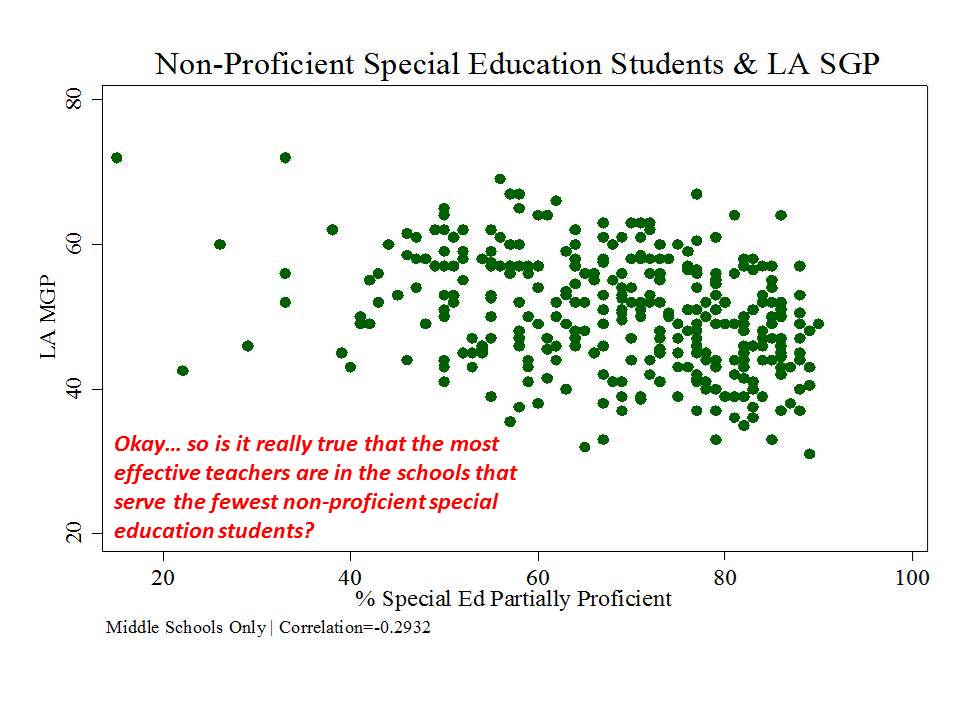
New York State
Then there are the New York State conditional Growth Percentile Scores. First, here’s what the state’s own technical report found:
Despite the model conditioning on prior year test scores, schools and teachers with students who had higher prior year test scores, on average, had higher MGPs. Teachers of classes with higher percentages of economically disadvantaged students had lower MGPs. (p. 1) http://schoolfinance101.files.wordpress.com/2012/11/growth-model-11-12-air-technical-report.pdf
And in an astounding ethical lapse, only a few paragraphs later, the authors concluded:
The model selected to estimate growth scores for New York State provides a fair and accurate method for estimating individual teacher and principal effectiveness based on specific regulatory requirements for a “growth model” in the 2011-2012 school year. p. 40 http://engageny.org/wp-content/uploads/2012/06/growth-model-11-12-air-technical-report.pdf
Concerned about what they were seeing, Lower Hudson Valley superintendents commissioned an outside analysis of data on their teachers and schools provided by the state. Here is a recent Lower Hudson Valley news summary of the findings of that report:
But the study found that New York did not adequately weigh factors like poverty when measuring students’ progress.
“We find it more common for teachers of higher-achieving students to be classified as ‘Effective’ than other teachers,” the study said. “Similarly, teachers with a greater number of students in poverty tend to be classified as ‘Ineffective’ or ‘Developing’ more frequently than other teachers.”
Andrew Rice, a researcher who worked on the study, said New York was dealing with common challenges that arise when trying to measure teacher impact amid political pressures.
“We have seen other states do lower-quality work,” he said.
http://www.lohud.com/article/20131015/NEWS/310150042/Study-faults-NY-s-teacher-evaluations
That’s one heck of an endorsement, eh? We’ve seen others do worse?
Perhaps most offensive is that New York State a) requires that if the teacher receives a bad growth measure rating, the teacher cannot be given a good overall rating and b) the New York State Commissioner has warned local school officials that the state will intervene “if there are unacceptably low correlation results between the student growth sub-component and any other measure of teacher and principal effectiveness.” In other words, districts must ensure that all other measures are sufficiently correlated with the state’s own junk measure.
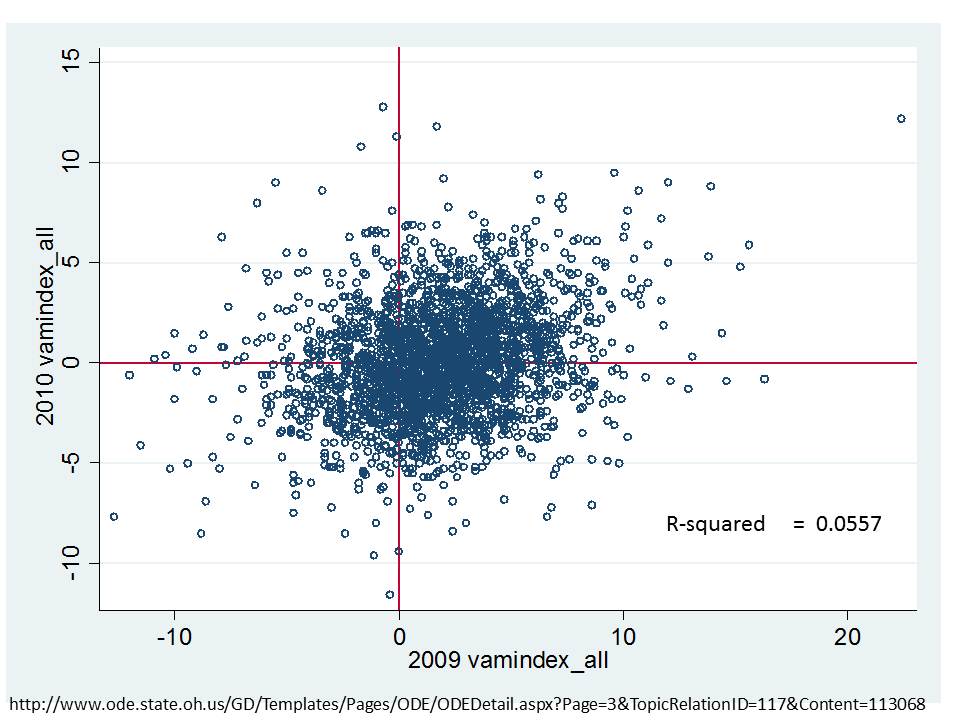
Ohio (school level)
In brief, in my post on Ohio Value Added scores, at the school level, I found that year over year correlations were nearly 0 – the year to year ratings of schools were barely correlated with themselves and on top of that, were actually correlated with things with which they should not be correlated. https://schoolfinance101.wordpress.com/2011/11/06/when-vams-fail-evaluating-ohios-school-performance-measures/
New Jersey (school level)
And then there’s New Jersey, which, while taking a somewhat more measured approach to adoption and use of their measures than in New York, has adopted measures which appear to be among the most problematic I’ve seen.
Here are a few figures:
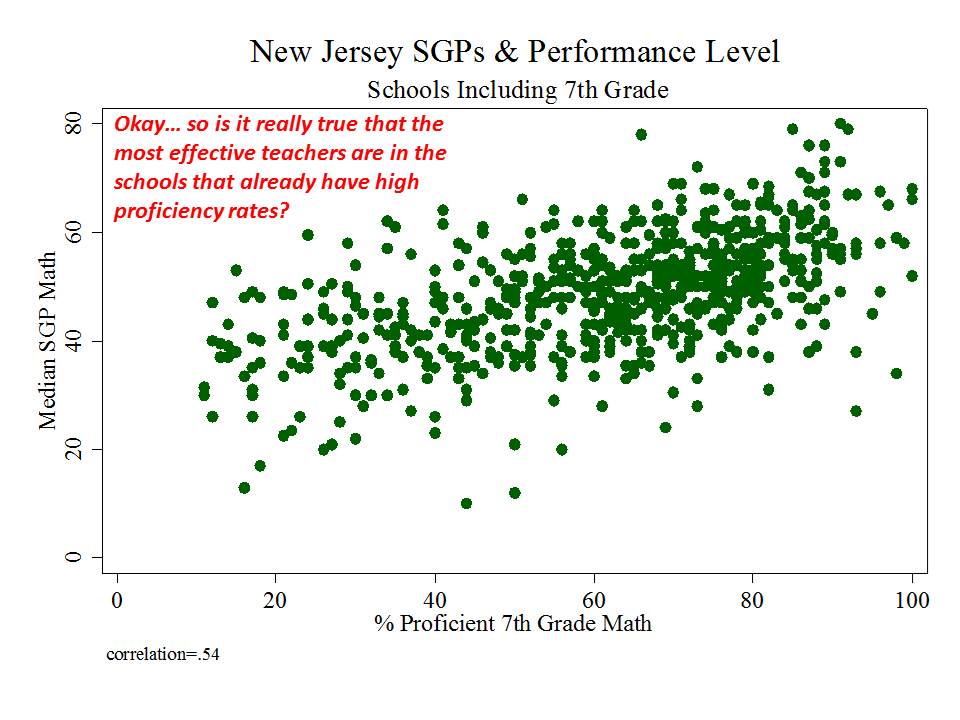
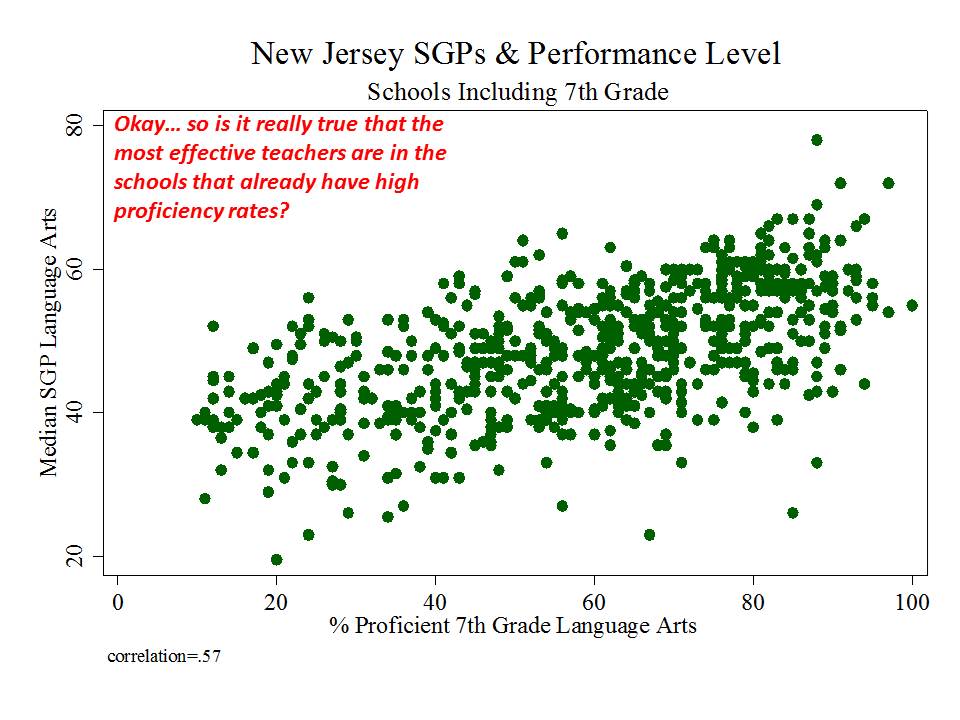
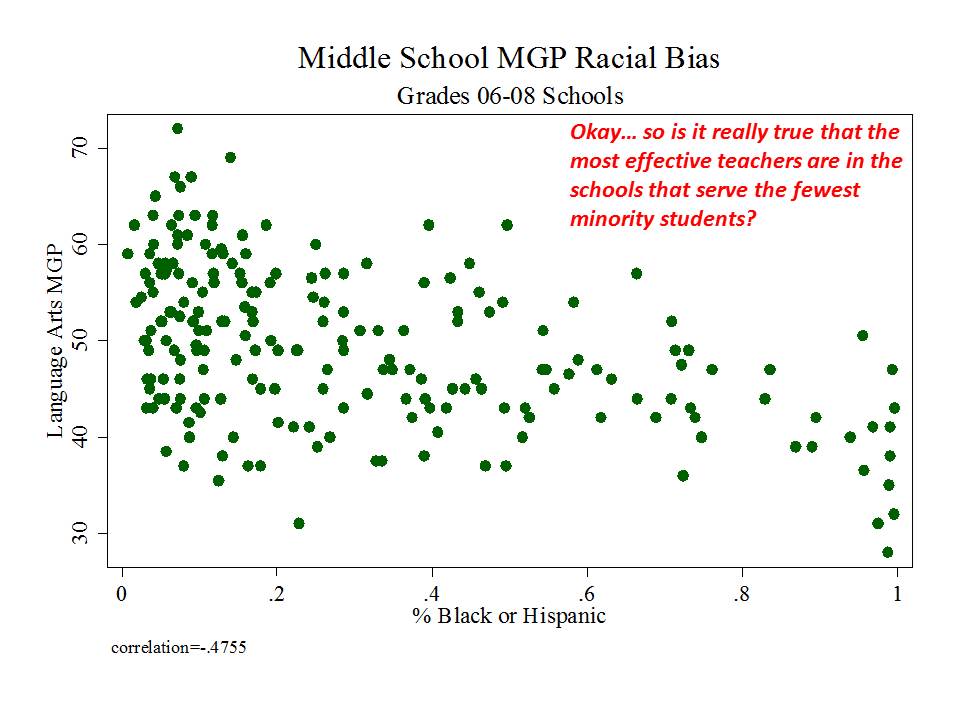
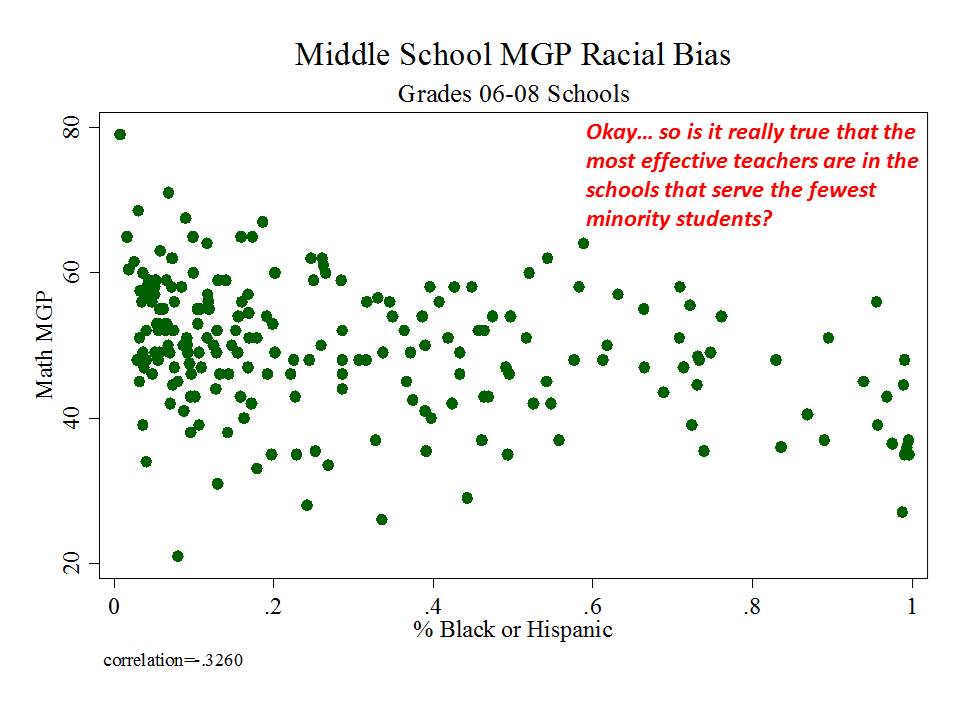
 And here is a link to a comprehensive analysis of these measures and the political rhetoric around them. http://njedpolicy.files.wordpress.com/2013/05/sgp_disinformation_bakeroluwole1.pdf
Conclusions & Implications?
At this point, I’m increasingly of the opinion that even if there was a possible reasonable use of value-added and growth data for better understanding variations in schooling and classroom effects on measured learning, I no longer have any confidence that these reasonable uses can occur in the current policy environment.
What are some of those reasonable uses and strategies?
First, understanding the fallibility of any one model of school or teacher effects is critically important, and we should NEVER, NEVER, NEVER be relying on a single set of estimates from one model specification to make determinations about teacher, or school… or teacher preparation program effectiveness. Numerous analysis using better data and richer models than those adopted by states have shown that teacher, school or other rankings and ratings vary sometimes wildly under different model specifications. It is by estimating multiple different models and seeing how the rank orders and estimates change that we can get some better feel for what’s going on (knowing what we’ve changed in our models), and whether or the extent to which our models are telling us anything useful. The political requirement of adopting a single model forces bad decision making and bad statistical interpretation.
Second, at best the data revealed by multiple alternative models might be used as exploratory tools in large systems to see where things appear to be working better or worse, with respect to producing incremental changes in test scores, where test scores exist and are perceived meaningful. That’s a pretty limited scope to begin with. But informed statistical analysis may provide guidance on where to look more closely – which classrooms or schools to observe more frequently. But, these data will never provide us definitive information that can or should be used as a determinative factor in high stakes personnel decisions.
But that’s precisely the opposite of current policy prescriptions.
Unlike a few years back, when I was speculating that such problems might lead to a flood of litigation regarding the fairness of using these measures for rating, ranking and dismissing teachers, we now have substantial information that these problems are real.
Even more so from a litigation perspective, we have substantial information that policy makers have been made aware of these problems – especially problems of bias in rating systems – and that some policymakers, most notably New York’s John King have responded with complete disregard.
Can we just make it all stop! ???

Can you comment on the fact that the NYS system doesn’t even attempt to control for class size even though class sizes are hugely variable across the state? And even though NYC’s earlier system claimed to have controlled for this factor, you found that teachers who woked at schools with larger average class sizes did worse in their ratings?
one issue is that we can try to control for certain things and achieve varied degrees of success in doing so. that’s what my previous finding regarding NYC ratings and class size indicates. One argument that growth model advocates use is that value added models including various additional measures can’t ever fully control for those things – and often lead to an overconfidence of inference regarding what might or might not be teacher or school effect. Fine. They are right on that. We can’t ever really know. Hence my argument that we should – if we ever use any of this – evaluate nuances across models… understand how changing the model changes ratings, rankings, etc… and patterns of them. The problem is that the solution presented by growth percentile advocates of simply not controlling for anything but prior score is a really dumb, really inadequate solution – especially when these data will still be used to make inferences about effectiveness. NYSED, I believe realized the extent of some of the biases and tried including some ex post corrections (as discussed in the AIR report). The Lower Hudson Valley supts analysis shows that didn’t cut it. Yes… class size is one potentially important variable to capture – do we really want to fire the teacher who got the lower rating just because they repeatedly had larger classes than their peers? Or do we really want to subject the school with larger class sizes to stricter policy interventions because our model failed to consider that they lacked the resources to provide smaller classes? Clearly all of this poses serious policy concerns. More to the point, the state’s willful disregard for the mounting evidence raises serious ethical, and eventually legal concerns.
I’m hoping you can shed some light on how VAM accounts for the issue of chronic absenteeism in schools. If there is an adjustment for absenteeism, is it a variable adjustment or more like an on/off switch? It is known that in high truancy schools, a teacher does not have the same set of students in the room each time a particular class meets, and that this may be the case for prolonged periods if not the entire school year. Has the idea been examined that at some point the rotating nature of high absenteeism an individual teacher experiences makes any use of growth scores invalid for that reason alone? For example, here’s what the situation in DC was earlier this year. 20% was the average chronic truancy rate for the district with it going as high as 66% at one school. A sub set of 4 schools in one part of the city had an average rate of 40%. To me chronic absenteeism as it affects VAM seems to be a trip wire situation, where where once it is triggered, nothing else matters. http://www.washingtonpost.com/blogs/therootdc/post/addressing-dcs-truancy-epidemic/2013/03/27/f500af5a-96f8-11e2-97cd-3d8c1afe4f0f_blog.html
The simple answer is, but for those cases where absenteeism creates missing data, it doesn’t. An additional complication is that absenteeism is of course not randomly distributed… and correlated with other stuff. I’m just finishing a report evaluating the linkages between poverty, chronic illness and absenteeism which finds (not surprisingly) strong relationships among the measures. Indeed it would be fun to have the classroom level data on absenteeism and chronic absenteeism and explore the relationship to teacher effect estimates.
I forgot to complete a thought and include another. It should read: “To me chronic absenteeism as it affects VAM seems to be a trip wire situation, where where once it is triggered, nothing else matters. It looks to be an unacknowledged way of evaluating teachers for the work of students they can’t really be said to have taught.
An additional problem is that in this age of scripted curricula, a teacher is damned if she forges ahead as required and double damned if she tries to get kids caught up.
Though I try not to belabor the point, I can’t help but think that based on what I’ve learned about VAM, this seems to be the fatal error that torpedo’s the entire enterprise.
I believe there may be some attempts to exclude data for excessively absent students. There are many fatal errors that torpedo the entire enterprise.
Thanks!
Don’t know if this will be of use to you or not, but it’s well worth sharing. http://www.attendanceworks.org/research/
Bruce, John King’s academic background just doesn’t have what it takes to understand the statistical issues, or the empirical/research issues you are bringing to the surface with your VAM analysis. I know the TC graduate program all too well – and there is no way he possesses the technical know how to think along your lines. This is, I think a real issue in the reformy world – wide eyed idealist (most with very good intentions I think) often from the MBA or JD world (or in the best of cases from the softcore education world) overly impressed with numbers, who do not understand many of the technical and empirical issues involved, who don’t read or even comprehend the technical education research, and who have limited to none experience or formal training is education (much less technical knowledge in statistics or research design), and yet who are obsessed with numerical representation of data, data mining, data driven decision making, etc as the holy grail of the reform agenda. Irony in that they do not understand it, and that now its coming back to haunt them. Anybody who sees the details of John King’s careers has to wonder – how did this man climb so fast so quickly on so little accomplishment (degrees in JD from Harvard and EDD from TC might sound like much but it really isn’t!). Few years teaching is a second class independent school in PR, a couple of years with his founder charter school and the leap to Uncommon Schools (which now appear to be all too common!) and then into the heights of NYSED? This is not unusual these days. And its not because we have this wave of brilliant minds finally enter the education field. My superintendent in NYC did not understand a regression line or the notion of weighted averages. The last two Chancellors in Puerto Rico has never even taken an undergraduate course in statistics (and they run a “data driven” operation of many billions!! hah. hah. which they can’t possibly understand or manage)… I doubt Joel Klein even took statistics in high school. I could go on and on. Given the elementary conceptual grasp of too many of these educational leaders, its not too difficult to understand how they can be taken for a ride on these kinds of issues…and this is quite aside from whether there is a political agenda (and in some cases financial interests) driving these numerically/statistically illiterate leaders…
Thought his JD was from Yale (http://usny.nysed.gov/about/commissioner_king.html), which by my recent experiences would be particularly telling – Yale law grads seem to have a high degree of confidence in data and technocratic solutions for which they possess very little mathematical or statistical understanding (see Connecticut’s Stefan Pryor, New Schools for New Orleans Neerav Kingsland, and NSVF’s Ben Riley, all of whom I’ve blogged about at one point or another). It’s almost as if it’s a requirement. Shedding all ethical concerns about how policies affect individuals’ lives is another piece of that puzzle… throw in some extreme arrogance and complete disregard for contradictory evidence (or inability to comprehend it) and you’ve got the complete package.
I should point out that I’m a TC grad (not necessarily proudly)… but will concur that I didn’t really learn my statistics at TC… that was mostly on the job training in my years of academe after the fact. I did have a great time series analysis class across the street at Columbia though.
By the way… when I saw your name… I went and checked your bio since you sounded familiar. I believe I filled the spot you left in science at Fieldston back in the 1990s. I stayed until 1997.
Bruce, john King bragged that the model was great because the categorical rating of 75% of the teachers went up or stayed the same! that means 25% went down. Given that it is a closed system, that is the percentages stayed the same, that implies that 25% went up.
So here we are. Teachers have a 50/50 chance of having the same rating in 2012-13 as they did in the prior year.
Bruce, Yup you replaced me at Fieldston when I left to work with Francisco Rivera Batiz at IUME Teachers College on the statewide study of teacher ed programs in PR – and then doubled up and got my phd in science ed. I love TC and I’m not an ungrateful Columbia grad – just realistic about the level of statistical knowledge the programs require (which is a elementary college level stats course). I’m also a former biologist turned academic and then school leader. Keep up the good work.
Yes… I recall hearing about your post-Fieldston work. I’m a bit more ambivalent about my TC days…
I too was a biologist in a past life (primarily molecular/genetics emphasis). But for me, those days are far in the past now. I suspect we’ll continue to cross paths in the future as we have in the past.
In NYC why do you think higher student attendance seems associated with poorer teacher evaluation?
Quite honestly… I really have no idea what’s going on underlying that relationship. Such are the complexities of the data. Sometimes they give us patterns which defy obvious explanations.
This is a guess since I haven’t looked at the data recently but three years ago I looked at the NYC school level and teacher level data and it seemed that schools and teachers at the extreme upper end of the performance curve (typically having very high attendance and close to perfect test scores, survey scores, etc.) had greater year to year variance than schools/teachers with more average performance. Some of this may be ceiling effects, regression to mean effects, or problems with the peer school factors used to calculate a schools grades. At the high end of the performance curve schools/teachers have minute differences between them – and yet the formula still penalizes schools performing low in that pack (peer schools) (low means – 1-2 multiple choice pts less or differences in attendance of 1-2%; ie meaningless differences). At this range in the performance curve Very minute (essentially random noise) differences from year to year can produce wild differences in school and teacher grades. I think this hypersensitivity may be part of the problem. Bruce – have you looked at this issue?
In New Mexico the claim is being made that “VAM estimates
based on 3 years of data are highly predictive of the fourth year of teacher VAM (r=.94).”
Thoughts?
First, I’d be shocked to see a correlation that high even between prior three and current year. Further, if I did, I’d be highly suspicious that the correlation is only that high because of persistent bias in the estimates- that the model fails to control adequately for conditions outside teacher’s control that happen to be fairly consistent conditions from year to year – like some teachers teaching higher versus lower poverty settings, higher versus lower initial performance settings. Such persistent biases leading to such high year over year correlations are much more likely in states using growth percentiles or particularly crude VAMs.
Thanks so much. I had similar thoughts. I appreciate the quick reply.