UPDATED 2/5/2015
I enter into this blog post knowing full well that this is a lose-lose deal. Rating and comparing school quality, effectiveness or efficiency with existing publicly available data is, well, difficult if not impossible. But I’m going there in this post.
Why? Well, one reason I’m going there is that I’m sick of getting e-mail and phone inquiry after inquiry about the same charter schools – and only charter schools – asking how/why are they creating miracle outcomes. I try to explain that there may be more to the story. The reporter then says that the charter school’s data person says I’m wrong – validating their miracle outcomes (despite their own data not being publicly available/replicable, etc. and often with reference to awesome outcomes reported in popularly cited studies of totally different charter schools).
But we may be having our conversation about the wrong schools to begin with. The whole conversation starts perhaps with a call from the school’s own PR lackey to the local paper, along with a self-congratulatory press release, or alternatively, from the local news outlet itself following up on preconceived notions of which schools are doing miracle work (for a slow news day). It’s not just that it seems always to be about charter schools, but that it seems to be about the same charter schools every time.
If I wanted my graduate students to figure out what makes successful schools tick, I’d want them to use a more thoughtful and rigorous selection strategy to identify those schools – rather than merely responding to press releases or preconceived notions.
What if instead, we started with a statistical analysis of all schools, from there, figuring out which schools actually do beat expectations? Which schools achieve greater gains than would be expected, given the students they serve and the resources they have available? There may indeed be some charter schools in this mix. I’d be surprised if there weren’t. They may or may not be the usual suspects. But also, there may be some traditional district schools in this mix. They (under the radar charters and district schools) just may not be puttin’ out those press releases or have PR lackeys hooked in with local media.
To begin with, let me clarify these terms – quality, effectiveness and efficiency – and explain how they have different meanings for different constituents – specifically for parent consumers versus policy makers.
First and foremost when we think of schools we must think of all of the stuff that goes into them and the community which surrounds them – which includes the qualities of the employees who work there, the children who attend and families who interact with the school, the facilities, the local taxpayer support, or not, for the schools. It’s a package deal. When a family chooses where to live or where to send their child to school, they are choosing not only the teachers, but also the building, and the peer group.
- Quality (unconditional) – we might broadly think of quality as the full package of what a school has to offer – including all of that stuff listed above, and how that stuff ultimately relates to how many kids go to college and where, what kinds of test scores kids get along the way (to the extent that they have any predictive value), what kinds of programs and services are offered and so on. But, as we know, quality in this broad sense, is highly related to community wealth, income and education levels and support provided for local schools. This is quality in an “unconditional” sense. “Best High School” Ratings like those in our popular monthly magazines found in dentists offices in the ‘burbs – those are classic unconditional rankings. Numbers of kids taking AP courses – average SAT scores, numbers of kids attending selective colleges are common measures and whether these outcomes are a function of the families and communities, or anything special the school might do is of minimal consequence.
- Effectiveness – One might consider “effectiveness” to be a conditional measure of quality – or at least I will frame it that way here. Effectiveness measures attempt to sort out whether and to what extent actual differences in schools contribute to those outcomes listed above. That is, if two schools served similar student populations, do they achieve different measured results? These are “conditional” comparisons – estimates the “effectiveness” of a school take into consideration those differences in children who attend the school. These measures are of greater interest to policymakers. We want to know not only if a school has high test scores, or shows strong growth, but also whether they do so while serving student populations similar to other schools. We want to know this in part so that we can draw inferences about whether the methods used by the school might be transferable. But, these measures are still only partly conditional. It may be that one school is more effective with certain children because it has access to more resources – has smaller class sizes, more specialized teachers, or has been able to recruit and retain a stronger team of teachers and administrators by paying more competitive wages. The school may be more “effective” because it has the resources to be more effective.
- Efficiency – Efficiency measures take the effectiveness measures one step further – considering not only if schools are able to produce comparable outcomes for comparable children, but also if they are able to do so with comparable resources. These measures are conditional on both student characteristics AND resources, and should provide us with a better picture of whether schools, given who they serve and the aggregate resources they have, are generating greater or lesser growth in student outcomes (based on the limited available measures).
At best – at best – at best – much like estimating teacher/classroom influences on student achievement growth – estimating school relative efficiency is imprecise and as much art as science. (see: http://cepa.stanford.edu/sites/default/files/2002316.pdf#page=19) As I often say, the art of working with existing data (publicly available or not) is the art of doing the “least bad analysis” possible.
So, all of that said, I’ve taken it on myself here to gather up data on school characteristics from 2010 to 2014 in New Jersey, the state’s student growth percentile data, as well as using statewide staffing file data to construct measures of school aggregate resources. These are updated versions of the models I use in this post: https://njedpolicy.wordpress.com/2014/10/31/research-note-on-student-growth-the-productivity-of-new-jersey-charter-schools/ Code is provided below.
Because there are geographic differences in economic, demographic and other environmental conditions I compare schools to all schools serving similar grade ranges in the same county, along with similar demographics and resource levels. Yes, the data are less precise than I’d like. But they are equally imprecise for everyone and publicly available (no one got to submit their own super secret version of data).
First, here’s a quick look at the models (each also contain a dummy variable for each county and for each year of background data):


As I’ve shown previously, these various factors explain a lot of the variation in school level growth measures, even state officials continue to live in denial (and construct consequential policies on that denial). Student population characteristics and resources are both associated with overall growth, explaining nearly 50% of the variation in some cases.
Across all 8 models, I can calculate which schools most consistently showed greater, or lesser “growth” on state assessments than predicted, given their students and resource levels. While I could have applied trickier statistical models – stochastic frontier, etc. – these really don’t change the rankings that much. And that’s what I’ve done to generate the following list of the “Top 50 productive efficient schools in New Jersey.” Notably absent here are any schools that serve only upper grades and thus have not growth percentile measure to model.
UPDATED LIST OF SCHOOLS! Updated NJ Rankings
Updated, updated Top 50 (not much change)

Now… is this list really all that meaningful? I’m not sure I’d go that far. Ratings are certainly somewhat sensitive to model specification, seem to shift from math to language arts and from year to year. There may indeed be some totally screwy results in these runs – as often happens when we try to take a model which relies on patterns across thousands to characterize the position of any one point.
However, it’s at least more defensible than relying on press releases and preconceived notions. AND, at the very least it’s a whole lot more interesting than hearing the same old story.
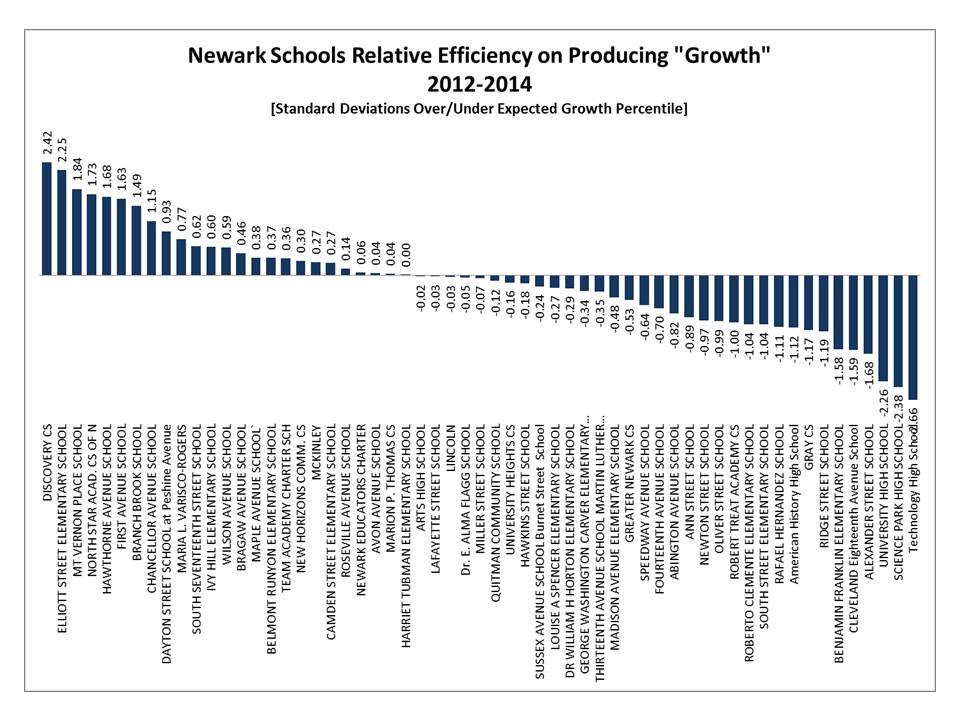
At least according to this list, if you’re looking for an interesting charter school to visit, check out Discovery. I know nothing about it… but its numbers POP here. If you’re looking for another school in Newark, how about Hawthorne Ave? which seems to beat most Newark Charter and District schools.
And to those out in the schools? Please don’t make too much of this list. It is what it is – based on narrowly defined outcome measures and excessively crude population measures.
Bonus Charts!
Schools within the City of Newark
Charter Schools Statewide

=====================
Geek stuff:
1) model output Stata output
2) data set building part I Step 1-Staffing Files
3) data set building part II Step 2-School Level Variables
4) data set building part III Step 3-School Resource Aggregation

I’ve thought about this a lot, possibly from a unique perspective. I worked for daily newspapers for many years, then took a 16-year sabbatical while my kids were in school, during which I became an active public-education advocate — and then went back to work for daily newspapers.
More skilled and seasoned education reporters generally aren’t rewriting press releases or hyping miracles (at least not the ethical ones — a surprising number have left their struggling field and gone to work in the lucrative “education reform” sector, though, so that does raise some questions about ethics and intent — obviously I could name names, but I don’t feel free to do that). “Reform” PR folks have often been canny about targeting columnists and newbie reporters who don’t have the background to know what to look for in the press releases about “miracles” and cluelessly join in the hype. All journalists know that rewriting press releases is poor-quality journalism, but a lot don’t really get that’s what they’re doing.
I still don’t get the groupthink and eagerness to leap into well-funded hype that we see with editorial boards, even though I work with those people. A goal of mine is to someday — some fascinating day — sit down with some current or former editorial-board members and find out how that thinking worked.
I do think that everyone involved has a bias toward change and promoting change that overcomes any tendency to question those who claim to be change-bringers. I was deeply involved in a research-and-information campaign questioning once-hyped, now-fizzled for-profit Edison Schools, and the resistance and skepticism directed at me even from people I knew well was startling. Later I was involved in advocating for improving the school food in my high-poverty urban school district, statewide and beyond, and the press was fully onboard with that, despite the “free choice” crap (I mean message) coming from various quarters. It felt like my and my compadres’ efforts were lifted and sent soaring by their support, though of course the challenges are great and improvement is step by step.
Explanations to the press need to be simpler and less wonky, than we tend to make them, though. I don’t have an easy answer for that.
“Student population characteristics and resources are both associated with overall growth, explaining nearly 50% of the variation in some cases.”
This comment raises a few of issues:
– That .488 R-squared is the highest. The average is much lower. It’s worth acknowledging how limited this model is. Understandably so, you note the difficulty of doing this with the available data. But to produce a long, detailed ranking seems a stretch. (And the list means little anyway – what conclusions can be drawn?)
– That said, if the data were available, it seems likely “student population characteristics and resources” would explain a lot more than 26-49% of the variation.
– It’s interesting that there is a big difference in the R-squared between LAL and Math. That is, the available data are much more explanatory for LAL. (The classic hypothesis is that math is less language dependent.)
On another topic – if we want to learn what is real in what charters do, and what is not, we’d need data that could measure some of the things that would seem to explain how some do better:
– Selective admissions and peer effects: Most successful charters have a de-facto process for selecting their student population. Some manage it more actively than others. Having a group of better supported, more easily educated children seems to be one of the key factors for successful charters.
We would need to be able to measure the student population in a meaningful way. But it’s not clear that’s possible.
– Measuring resources: If charters get longer days while paying teachers the same or less, they are more efficient in that sense. So we can’t just measure inputs (teacher salaries), that effect would need to be factored in. (The sustainability of that for teachers is a separate question.)
a few quick points.
1 – the dependent variable is a growth score, much noisier than the mean scale scores, and already conditional on prior scores. Thus, the lower rsq values. If using mean scale scores or proficiency rates, these models explain 70 to 80% variance.
2- math growth scores are compromised, I believe by the substantial ceiling effect on our state math assessments. There’s less variance overall… in both the scale scores and resultant growth scores. The variance that remains is noisier than for LAL. This is the opposite of what I’ve found in most other state data sets.
3- on the point of digging deeper… that’s actually the basis of an assignment I give my finance class. I run similar models to screen more and less “efficient” schools and then provide detailed staffing information, fiscal resource allocation, etc. and have the students explore factors that might go further in explaining why/how some schools appear to do better than others. I explore some similar “sustainability” questions here: https://njedpolicy.files.wordpress.com/2015/01/bbaker-njcharters-20151.pdf
Therein lies the best use (if any) for this type of analysis – as a noisy screening tool… a starting point for deeper exploration. As you note (and as I point out in the post) one really can’t make much of the list of individual schools – their rankings. But one might use such information as a starting point for the deeper dive (though in this case, I’d probably take these models a few important steps forward first).