Published by schoolfinance101
Bruce Baker is an Professor in the Graduate School of Education at Rutgers, The State University of New Jersey. From 1997 to 2008 he was a professor at the University of Kansas in Lawrence, KS. He is lead author with Preston Green (Penn State University) and Craig Richards (Teachers College, Columbia University) of Financing Education Systems, a graduate level textbook on school finance policy published by Merrill/Prentice-Hall. Professor Baker has written a multitude of peer reviewed research articles on state school finance policy, teacher labor markets, school leadership labor markets and higher education finance and policy. His recent work has focused on measuring cost variations associated with schooling contexts and student population characteristics, including ways to better design state school finance policies and local district allocation formulas (including Weighted Student Funding) for better meeting the needs of students.
Baker, along with Preston Green of Penn State University are co-authors of the chapter on Conceptions of Equity in the recently released Handbook of Research Education Finance and Policy, and co-authors of the chapter on the Politics of Education Finance in the Handbook of Education Politics and Policy and co-authors of the chapter on School Finance in the Handbook of Education Policy of the American Educational Research Association.
Professor Baker has also consulted for state legislatures, boards of education and other organizations on education policy and school finance issues and has testified in state school finance litigation in Kansas, Missouri and Arizona. He is a member of the Think Tank Review Panel, a group of academic researchers who conduct technical reviews of publicly released think tank reports on education policy issues.
View all posts by schoolfinance101
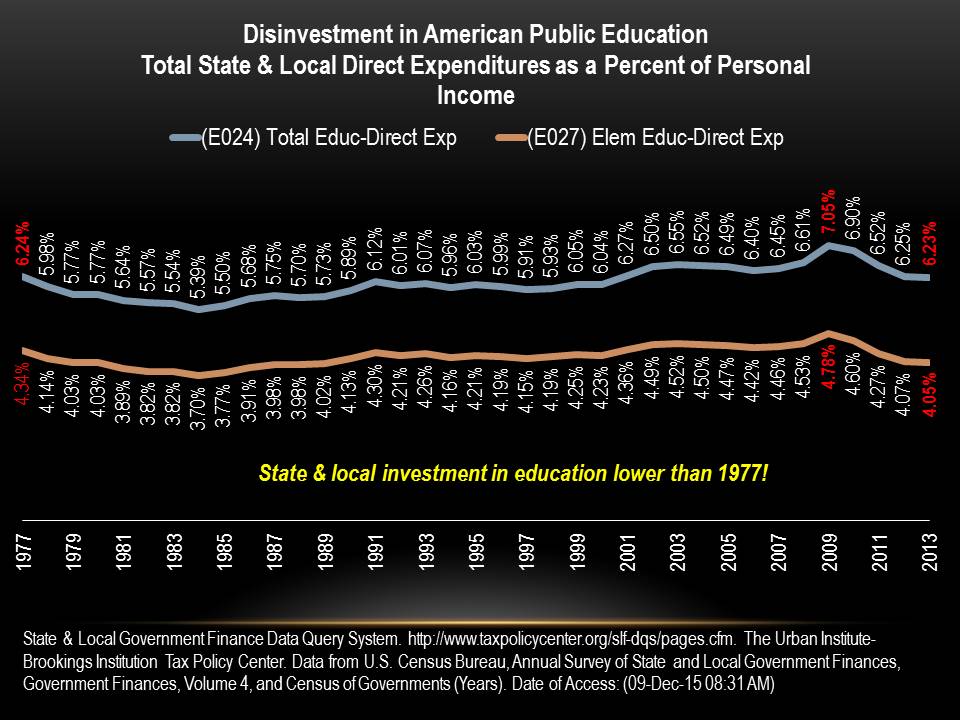

This is an important “macro” way of looking at the prioritization of education relative to other areas of investment over time. Of course, you often point out that averages conceal variation. For example, some states routinely invest in education more aggressively than others. Have a look at the (open data) EdSource States In Motion series for additional insights, particularly state-level differences in this investment pattern. Chart 6 is the most directly relevant: http://edsource.org/2015/states-in-motion-school-finance-naep-child-poverty/83303#6
The States In Motion series includes data back to 1970, which shows the downward trend even more clearly. Prop 13 crushed relative per capita expenditures on education in California, and the state has never recovered.
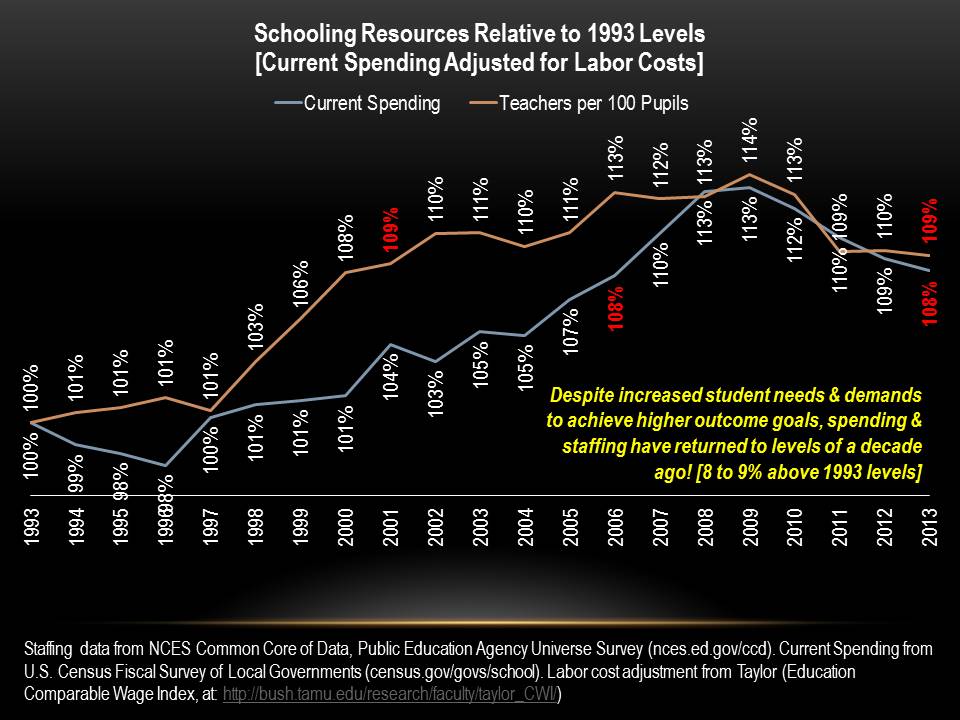
Two small caveats: 1) a portion of the downward drift can appropriately be attributed to the happy fact that people are living longer, and also that families have shrunk. There are slightly more taxpayers per student than there were in the past. 2) I have mixed feelings about using the Taylor education labor cost series (or similar). The rising costs of education are important, and they are an issue worthy of separate consideration. See Ed100 lesson 8.2. http://ed100.org/support/eddollars/ Why separate them? Because the elements driving costs represent both market conditions and policy choices. For example the traditional villain in the “fast-rising costs” story is teacher pay… but that story doesn’t seem to wash, since growth in teacher salaries has actually merely kept pace with median wage growth. See Ed100 lesson 3.1 http://ed100.org/teachers/talent/.
It is my impression that expenditures on health care and financial services have risen as a percentage of the economic pie, squeezing education (and especially universal K12). It would be interesting to see a presentation of long-term data about the evolution of the “pie”. Maybe you know of one?
I also wonder about international differences in expenditures on education as a percentage of the economy (as measured by personal income). This seems like an important lens: some cultures (e.g. Finland, Cuba, Korea, the Singapore region) are often held up as examples of places that have a culture of strong investment in education. Inconsistency in the structure of education finance make these comparisons difficult, I think — for example Japan and Korea have flourishing private tutoring industries that America does not. Perhaps you have some insights.