THIS IS A FIRST CUT AT MY MUSINGS ON THE RELATIONSHIP BETWEEN PARCC AND NJASK SCORES ACROSS NEW JERSEY SCHOOLS. MORE REFINED BRIEF FORTHCOMING. BUT I WANTED TO GET SOMETHING OUT THERE ASAP.
A little background
During the spring of 2015, New Jersey schools implemented their first round of new assessments from the Partnership for Assessment of Readiness for College and Careers (PARCC). This test replaced the New Jersey Assessment of Skills and Knowledge (NJASK). Like NJASK, PARCC includes assessments of English Language Arts and Mathematics for children in grades 3 to 8. PARCC also includes a separate assessment of Algebra 1, administered to some 8th grade Algebra students, and other high school algebra students. PARCC also includes Geometry, Algebra 2, and a high school level language arts assessment.
Adoption of PARCC, and the name of the consortium itself are tied to a nationwide movement to adopt standards, curriculum and assessments which more accurately reflect whether or not students are “ready” for “college.”[1] Research on “college readiness” per se dates back for decades, as does policy interest in finding ways to increase standards in elementary and secondary education in order to reduce the remediation rates in public colleges and universities.[2]
Statistical evaluations of college readiness frequently define “readiness” in terms of successful completion of credit bearing (usually college level mathematics) courses during the first two years of undergraduate education.[3] Thus, when evaluating preparation for college, the goal is to identify measures or indicators that can be collected on students in elementary and secondary education that reasonably predict increased odds of “success” (as defined above). Detailed analyses of student transcript data dating back to the 1980s (with numerous subsequent similar studies in the following decades) point to such factors as highest level of mathematics courses successfully completed.[4]
Others have sought to identify specific tests and specific scores on those tests which might be associated with improved odds of undergraduate “success.”[5] One commonly cited benchmark for “college readiness” drawn from research on predicting success in college level coursework, is a combined SAT score of 1550.[6] Because of the availability of SAT data, others have evaluated their own state assessments, adjusting performance thresholds, to align with this SAT standard.[7] This SAT-linked standard is partial basis for the determination of cut scores in the PARCC exam.
While state officials in New Jersey and elsewhere have hyped the new generation of Common Core aligned assessments of “college readiness” as being more analytic, requiring deeper reasoning, problem solving and critical thinking, PARCC and its cousin SBAC (Smarter Balanced Assessment Consortium) are still rather typical standardized assessments of language arts and math. Cut scores applied to these assessments to determine who is or isn’t college ready are guided by other typical, highly correlated standardized tests previously determined to be predictive of a limited set of college academic outcomes.[8]
When state officials in New Jersey and elsewhere caution local district officials to avoid the desire to compare results of the new test with the old, they ignore that the statistical properties of the new tests are largely built on the design, and results (distributions) of other old tests, and dependent on the relatively high correlations which occur across any diverse sample of children taking nearly all standardized assessments of reading and math.
PARCC does offer some clear advantages over NJASK.
- Accepting the limitations of existing benchmark predictors of college readiness (like the SAT 1550 benchmark), PARCC cut-scores are, at least, based on some attempt to identify a college readiness standard. They are linked to some external criteria. By contrast, in all of the years that NJASK was implemented, department officials never once evaluated the predictive validity of the assessment, or the cut scores applied to that assessment (but for early studies which evaluated the extent to which ASK scores in one grade were predictive of ASK scores in the next). Other states, by contrast have conducted analyses of their pre-Common Core assessments,[9] and current assessments.[10]
- Use of PARCC will permit more fine grained comparisons of performance of New Jersey students, schools and districts to students, schools and districts in other states using PARCC assessments. While NAEP permits cross state comparisons, it does not sample children across all schools, districts and grades, nor are data made available at the district or school level.
- NJASK had a substantial ceiling effect on middle grades math assessments, reducing measured variations among students and schools. That is, in any middle to upper income school in New Jersey, significant numbers of children in grades 4 to 7 would achieve the maximum score of 300 on the NJASK math assessments. That is, children with high math ability achieved the same score, even if their abilities varied significantly. PARCC appears not appear to suffer this shortcoming.
But, while these obvious and relevant advantages exist, PARCC should not be oversold:
- Just because PARCC is, in some ways, statistically ‘better’ than ASK doesn’t mean that it is statistically sufficient for such tasks as accurate evaluation of teacher effects. Further, it doesn’t fix, by any stretch of the imagination, the well understood shortcomings of SGPs (it results in slight improvements in middle grades math, because it eliminates the ceiling effect, but this is like giving the titanic a new paint job). SGPs applied to PARCC, just like their application to NJASK, will continue to result in biased measures of teacher and school contributions to student achievement gains, as the modeling approach, regardless of underlying data/measures, fails to account for student characteristics and other uncontrollable factors.[11]
- Use of cut-scores to categorize performance with PARCC is just as bad as with ASK. It results in substantial information loss and ignores the statistical reality that a child who has gotten one (or a few) additional items incorrect, potentially moving him/her above or below the cut score may be no different in ability, knowledge or skill in that subject area than the child who did not. The consequences of these arbitrary and statistically invalid classifications can be significant.[12]
- Use of a different test – even if more validly linked to an external standard (“college readiness”) does nothing to resolve problems with the state’s approach to classifying school performance for accountability purposes, including overall classification of schools and/or measurement of subgroup achievement gaps.[13] The state’s current approach to using assessment data to identify FOCUS or PRIORITY schools remains entirely invalid for attributing effectiveness, reckless, irresponsible and counterproductive. [14] Notably, state officials were merely following federal guidance in their adoption of their current approach.
How related are variations in PARCC scores with variations in ASK scores across New Jersey schools?
State officials have offered limited guidance to school administrators, policymakers and the general public regarding interpretations of PARCC scores and proficiency rates. Most of the advice rendered by state officials has focused on not comparing new tests to old, and accepting the assertions that the new tests are a higher standard – a standard legitimately and validly linked to measuring “college readiness” and – built on tests that explore much deeper knowledge and skills than previous tests. Thus, as scores (or proficiency rates) plummet, the public and school officials must understand that this is because the test is totally different and based on a real, external standard!
State officials explain:
In the 2014-2015 school year, all students in grades 3-8 and high school took the new PARCC tests for the first time. The scores from this first year of PARCC tests will appear lower for many students. This is because the new tests now match the more challenging standards and focus on real-world skills, such as problem solving and critical thinking.[16]
That is, it is the state’s assertion that scores are “lower” because the test is substantively different from the previous tests and far more complex. Thus, scores, or at least shares of children achieving sufficient cut scores will be lower.
Actually, the scores (scale scores) will be higher, because they have been assigned to a higher numerical scale (an arbitrary determination). The cut scores will also be a higher number (750 on PARCC instead of 200 as on NJASK) because they are set to a point in that higher range that is associated with specific scores on other tests, which are associated with select undergraduate outcomes. But still, we are measuring basic reading and math skills of elementary and middle school students. We are measuring them on a different scale (where we’ve chosen the numerical assignments of those scales arbitrarily) and applying to that scale, blunt determinations in the form of cut scores which identify one child’s score as proficient, and another child’s score, perhaps only one more question answered incorrectly, non-proficient.
Let’s put this into context by comparing the change in scale to changing how we measure temperature. Let’s say we have long accepted the Fahrenheit scale for measuring temperature and let’s say (for arguments sake) that we have adopted a standard that 65 degrees Fahrenheit qualifies a day as being “warm.” (Yes, it’s unlikely we would make any such foolish determination because we understand that 64 and 66 degrees may not really feel all that different… because it isn’t!).
One day, a new mandate comes down making the Celsius scale the new standard. Along with that, those making the rules determine that the cut-score for a warm day shall now be 20 degrees Celsius. We wake up on that day to see that it’s only 18.33 degrees (Celsius) outside, so we layer up to face the elements, not totally getting the change in temperature scale. We are also told by our trusted weather-person that it’s not quite warm out there (heck, it’s not even 20 degrees!). But yesterday, it was 65 degrees, officially “warm” and quite pleasant. Strangely, when we get outside all layered up, it feels a lot like yesterday. And then we whip out our trusty iPhone conversion app to realize that 18.33 Celsius is 65 Fahrenheit. Nothing has changed with the actual weather. What has changed is the scale by which we measure it, and cut points we have assigned to determine what’s “warm” and what isn’t. Of course, temperature is temperature and the conversion of one scale to another, when measuring temperature is rather precise.
So then, how closely related are ASK and PARCC scores, when taken across all New Jersey Schools and are they sufficiently correlated that we can consider them to be largely the same, and can use that sameness to determine the conversion calculation from one to the other?
Table 1 summarizes the cross school correlations a) between ASK scores in 2013 and 2014 and between ASK and PARCC scores in 2015 and 2016. We include the previous year ASK to ASK correlation to point out that even when correlating the same test year over year, the correlation is not a perfect 1.0. But it is rather strong at around .90 for most grade levels. That is, if we know where a school falls in the distribution of ASK scale scores in one year, we can be pretty certain where that same school falls the following year on the same test. If your average was 200 last year on grade 3 math, it’s likely to be close to 200 this year.
Interestingly (though hardly surprising), the ASK to PARCC correlation is nearly the same for most tests. The biggest departure is for the 8th grade math assessment, in part because many students at the high end of the ASK distribution are no longer in the PARCC general math distribution (as they take the Algebra assessment instead). Put simply, PARCC is essentially STATISTICALLY EQUIVALENT TO NJASK – just on a different scale. Results on PARCC correlate as nearly to 1:1 with ASK as ASK did with itself in previous years!
Table 1
Cross School, Year over Year Correlations
| ASK – ASK (2013-2014) | ASK-PARCC (2014-2015) | ||||
| Grade Level | ELA | Math | ELA | Math | |
| Grade 3 | 0.908 | 0.884 | 0.879 | 0.856 | |
| Grade 4 | 0.918 | 0.884 | 0.899 | 0.883 | |
| Grade 5 | 0.925 | 0.907 | 0.902 | 0.886 | |
| Grade 6 | 0.947 | 0.920 | 0.897 | 0.907 | |
| Grade 7 | 0.957 | 0.929 | 0.903 | 0.899 | |
| Grade 8 | 0.954 | 0.928 | 0.866 | 0.587 | |
How much does a PARCC proficiency cut score requirement of 750 raise (or lower) the bar when compared to an ASK proficiency cut score of 200?
Because ASK and PARCC scores are so highly correlated year over year, it is reasonable to use these data to construct what is commonly referred to as a concordance table – where we can see what specific PARCC score is associated with a specific ASK score. We can construct these tables by fitting a “regression” equation to the relationship between ASK scores and PARCC scores for any grade level and subject area. We’ll see how clear these relationships are in the next section. Here, in Table 2 and Table 3, we share our conversion results.
Table 2 summarizes the regression equation and select concordance results for English Language Arts, for converting school mean scale scores. For grade 3, for example, the equation to convert a school mean PARCC score to an ASK equivalent is:
ASK = -190.45 + .533 x PARCC
If your school average PARCC score was 700, that would be:
183 = -190.45 + (.533 x 700)
That is, if your average was 50 points below the current PARCC standard, your average was 17 points below the old ASK standard, for grade 3 ASK language arts. Each grade and subject has a different equation. That said, if you were right at the proficiency cut for PARCC, you were slightly above the proficiency cut for ASK. Put differently, the proficiency standard for PARCC is about 9 points higher (in ASK scale points) than the old proficiency cut for ASK, grade 3 language arts.
Table 2
ELA PARCC to ASK Conversion Table
| Constant | Coefficient (x PARCC) | If PARCC Mean Scale Score Is | Then
Equivalent ASK Mean Is |
If PARCC Mean Is | Then
Equivalent ASK Mean Is |
||
| Grade 3 | -190.45 | 0.533 | 750 | 209 | 700 | 183 | |
| Grade 4 | -263.75 | 0.622 | 750 | 203 | 700 | 171 | |
| Grade 5 | -370.98 | 0.769 | 750 | 205 | 700 | 167 | |
| Grade 6 | -362.44 | 0.767 | 750 | 213 | 700 | 174 | |
| Grade 7 | -393.20 | 0.806 | 750 | 211 | 700 | 171 | |
| Grade 8 | -200.06 | 0.560 | 750 | 220 | 700 | 192 |
Table 3 provides the conversions for math. The conversion procedure is the same. A notable difference is that achieving an average scale score, schoolwide, that would qualify as “proficient”, requires achieving what would have been much higher NJASK scores. Here, the standard is raised by around 40 NJASK points.
Table 3
Math PARCC to ASK Conversion Table
| Constant | Coefficient
(x PARCC) |
If PARCC Mean Scale Score Is | Then Equivalent ASK Mean Is | If PARCC Mean Is | Then
Equivalent ASK Mean Is |
||
| Grade 3 | -627.18 | 1.151 | 750 | 236 | 700 | 179 | |
| Grade 4 | -704.91 | 1.257 | 750 | 238 | 700 | 175 | |
| Grade 5 | -640.67 | 1.176 | 750 | 241 | 700 | 183 | |
| Grade 6 | -656.48 | 1.193 | 750 | 238 | 700 | 179 | |
| Grade 7 | -832.81 | 1.417 | 750 | 230 | 700 | 159 |
Figure 1 provides a graphic representation of the shift in proficiency standards which occurred with the adoption of PARCC and the 750 cut score. The standard is raised most for grades 3 to 6 in math and least (barely at all) in grades 4 and 5 in language arts.
Figure 1

Distributions of missing scores
Table 4 summarizes the “valid score” shares for PARCC based on school level reported data. For PARCC, we divide the “valid score” count by the count of students “Registered to Test,” which presumably includes some combination of tests that were taken, submitted and eventually invalidated, tests that were not taken but still submitted and invalidated (name, etc. filled out, student sat for test, but did not actually fill in test), and tests that were simply not taken nor submitted among students who were registered to be tested.
There has been much speculation that the “opt-out” movement in New Jersey and elsewhere has largely and systematically been an affluent suburban movement. This speculation has, at best, been supported thus far by anecdote, such as lists of affluent schools with apparently high opt-out rates.[1] While the data here do not precisely identify those who opted out in protest, they do present rates of valid scores, which are reduced in part as a function of opting out.
Table 10 summarizes valid score shares by District Factor Group, where DFG I & J districts tend to be relatively affluent suburban districts of the type characterized as leading the opt-out movement. Cells are color coded such that deeper shades of red indicate substantively lower rates of valid scores – potentially partially driven by opting out. In grades 3 to 5, we see only one area of lower valid score shares – for Grade 4 math in DFG J. Yet, valid scores for Grade 4 ELA in DFG J are actually higher and in the lowest income districts (DFG A&B), making it unlikely that a suburban “opt-out” movement was driving this difference.
Table 4
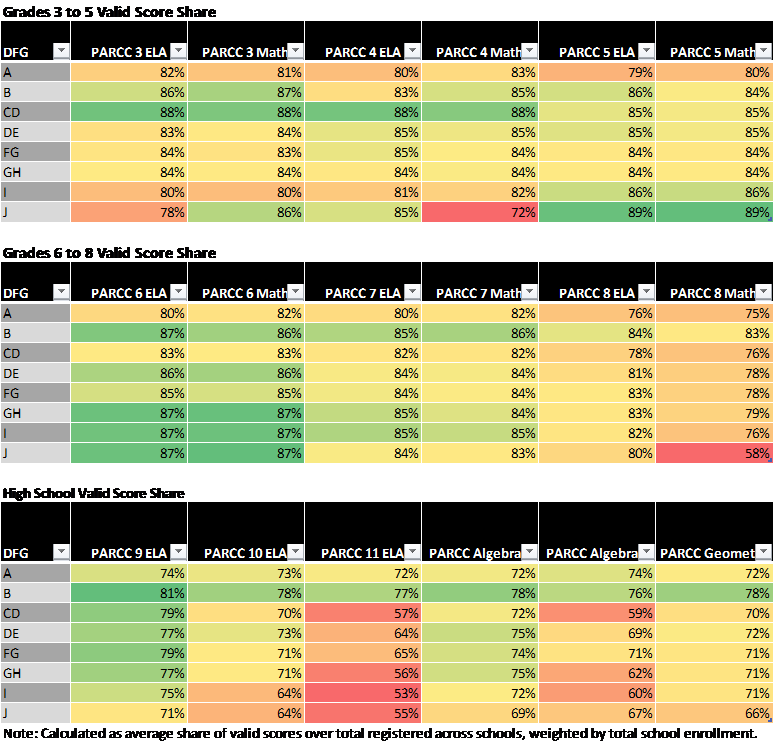
For middle grades, we also see no clear pattern whereby shades of orange deepen as we move from low income to higher income districts. In fact, in many cases, valid score shares are higher in the affluent districts than in the poor districts. The one exception is for grade 8 math. But again, for the same grade, ELA assessment, valid score shares are actually higher for high income than low income communities, suggesting that some other factor is at play (including the possibility of much larger shares of 8th grade children in affluent communities taking either the Algebra or Geometry exams, and the registration procedure for the exams not correctly accounting for these differences).
Finally, for high school exams we do see some disparities, but mainly if not exclusively for the Grade 11 language arts exam. We do not, however see that only the most affluent districts had low rates of valid scores. Rather, all but the lowest income districts seem to have depressed valid score shares.
[1] http://www.njspotlight.com/stories/16/02/21/the-list-nj-schools-with-the-most-students-not-taking-the-parcc-testing/#
NOTES
[1] http://parcconline.org/ see also: http://achieve.org/
[2] Cilo, M.R & Cooper, B.S. (June 1999). Bridging the Gap between School and College: A Report on Remediation in New York City Education. New York: Mayor’s Advisory Task Force on the City University of New York.
[3] See: http://www.parcconline.org/files/40/Technical%20Advisory%20Committee/48/Defining-Measuring-CCR-Camara-Quenemoen.pdf
[4] Alexander, K.L, Holupka, S., & Pallas, A.M. (1987) Social Background and Academic Determinants of Two-Year versus Four-Year College Attendance: Evidence from Two Cohorts a Decade Apart. American Journal of Education 96 (1) 56-80. Alexander, K.L. & Pallas, A.M. (1984) Curriculum Reform and School Performance: An Evaluation of the New Basics. American Journal of Education 92 (4) 391-420. Alexander, K.L., Riordan, C., Fennessey, J., Pallas, A.M. (1982) Social Background, Academic Resources, and College Graduation: Recent Evidence from the National Longitudinal Survey. American Journal of Education 90 (4) 315-333 Altonji, J.G. (1992) The Effects of High School Curriculum on Education and Labor Market Outcomes. Working Paper No. 4142. Cambridge, MA: National Bureau of Economic Research.
[5] Wyatt, J., Kobrin, J., Wiley, A., Camara, W. J., & Proestler, N. (2011). Development of a college readiness benchmark and its relationship to secondary and postsecondary school performance (No. 2011-5). College Board Research Report.
[6] Wyatt, J., Kobrin, J., Wiley, A., Camara, W. J., & Proestler, N. (2011). Development of a college readiness benchmark and its relationship to secondary and postsecondary school performance (No. 2011-5). College Board Research Report.
[7] http://usny.nysed.gov/scoring_changes/MemotoDavidSteinerJuly1.pdf
[8] See: http://www.parcconline.org/files/40/Technical%20Advisory%20Committee/48/Defining-Measuring-CCR-Camara-Quenemoen.pdf
[9] http://usny.nysed.gov/scoring_changes/Koretz_6.20.pdf
[10] http://www.mathematica-mpr.com/our-publications-and-findings/publications/predictive-validity-of-mcas-and-parcc-comparing-10th-grade-mcas-tests-to-parcc-integrated-math-ii
[11] https://njedpolicy.files.wordpress.com/2014/06/bbaker-sgps_and_otherstuff2.pdf
[12] Papay, J. P., Murnane, R. J., & Willett, J. B. (2010). The consequences of high school exit examinations for low-performing urban students: Evidence from Massachusetts. Educational Evaluation and Policy Analysis, 32(1), 5-23.
[13] See: https://schoolfinance101.wordpress.com/2015/01/16/the-subgroup-scam-testing-everyone-every-year/
[14] See, for example: https://schoolfinance101.wordpress.com/2012/09/12/ed-waivers-junk-ratings-misplaced-blame-jersey-edition/ & https://schoolfinance101.wordpress.com/2012/09/27/school-labels-housing-values-potential-consequences-of-njdoes-new-arbitrary-capricious-school-ratings/
[15] http://www.nj.gov/education/schools/achievement/15/parcc/

The question that comes to my mind as a parent and taxpayer is the one of cost. If the PARCC measures are essentially raising the NJASK standard by 40 points and improving the Middle Grade ceiling height in mathematics, are the exorbitant costs incurred in switching to this test and its computerized administration worth the other “improvements” in data? And that does not even begin to address the broader philosophical and political issues involved.
Certainly does raise an important cost-benefit issue.
I have addressed some of those broader issues here: https://schoolfinance101.wordpress.com/2015/01/14/cutting-through-the-stupid-in-the-debate-over-annual-testing/
My sense is that most of the things tested by the PARCC are things we have no evidence can be effectively taught: https://spottedtoad.wordpress.com/2016/01/19/the-g-loaded-common-core/