What can we learn by modeling existing variations in school spending and outcomes? (Reprise)

There are those in the ed reform world who would tell us that existing public schools and districts are simply inefficient in their use of existing funding. That all schools and districts have enough or more than enough funding to achieve whatever goals are demanded of them, but because most of the dollars flow into a system, for example, wherein teachers are paid according to years of experience and degrees accumulated, and not directly related to student outcomes they produce, improvements cannot be achieved by providing more funding.

However, this claim is built on mythical and unfounded assumptions that an alternative system, for example, based entirely on market competition, where teachers are paid, hired and fired by the outcomes they produce (where linking pay precisely to valid, measured outcomes is feasible) would propel U.S. schools to the top of international rankings, and for even less than we currently spend.

As I explain in a 2016 report:

“To summarize, despite all the uproar about paying teachers based on experience and education, and its misinterpretations in the context of the “Does money matter?” debate, this line of argument misses the point. To whatever degree teacher pay matters in attracting high-quality educators into the profession and retaining them, it’s less about how they are paid than how much. Furthermore, the average salaries of the teaching profession, with respect to other labor market opportunities, can substantively affect the quality of entrants to the teaching profession, applicants to preparation programs and student outcomes. Diminishing resources for schools can constrain salaries and reduce the quality of the labor supply. Further, salary differentials between schools and districts might help to recruit or retain teachers in high-need settings. In other words, resources used for teacher quality matter.”[1]

Recent studies finding positive effects of school finance reforms also find that additional funding (that yielded the positive effects) tended to go toward such things as more competitive wages for teachers or smaller class sizes.[2]

This claim is also used to argue that we can learn nothing about the actual costs of producing the outcomes we desire by studying spending and spending variation in existing schools. That is, how could we possibly learn anything about efficient costs of providing the services we desire from a system that includes no institutions that presently use resources efficiently? Again, this argument is built on a false and unfounded premise.

  • Existing schools and districts do, in fact, vary in the amounts of money they spend, the outcomes they achieve with that spending and efficiency with which they yield those outcomes.[3]
  • Existing schools and districts vary to some degree in the ways in which they allocate resources toward those goals.
  • Notably, even elite private independent schools operating on the “free market” tend not to attempt to compensate, hire or fire teachers based on student outcomes the produce. These same schools extol the virtues – from a marketing perspective – of providing particularly small class sizes.[4]
  • Similarly, charter school expansion – intended to promote innovation – has not led to substantive deviation either from the way in which teachers are paid, or from the basic ways in which resources are allocated within schools.[5]

To date, no radical substitutions to the way in which public, private and charter schools provide k12 have been identified and validated as substantially more productive or efficient than existing school systems. Good schooling of any kind remains a human resource intensive endeavor, requiring a sufficient quantity of sufficiently qualified adults interacting with children, with sufficient material resources, in quality education spaces. And students have to get there and be sufficiently well nourished to thrive.

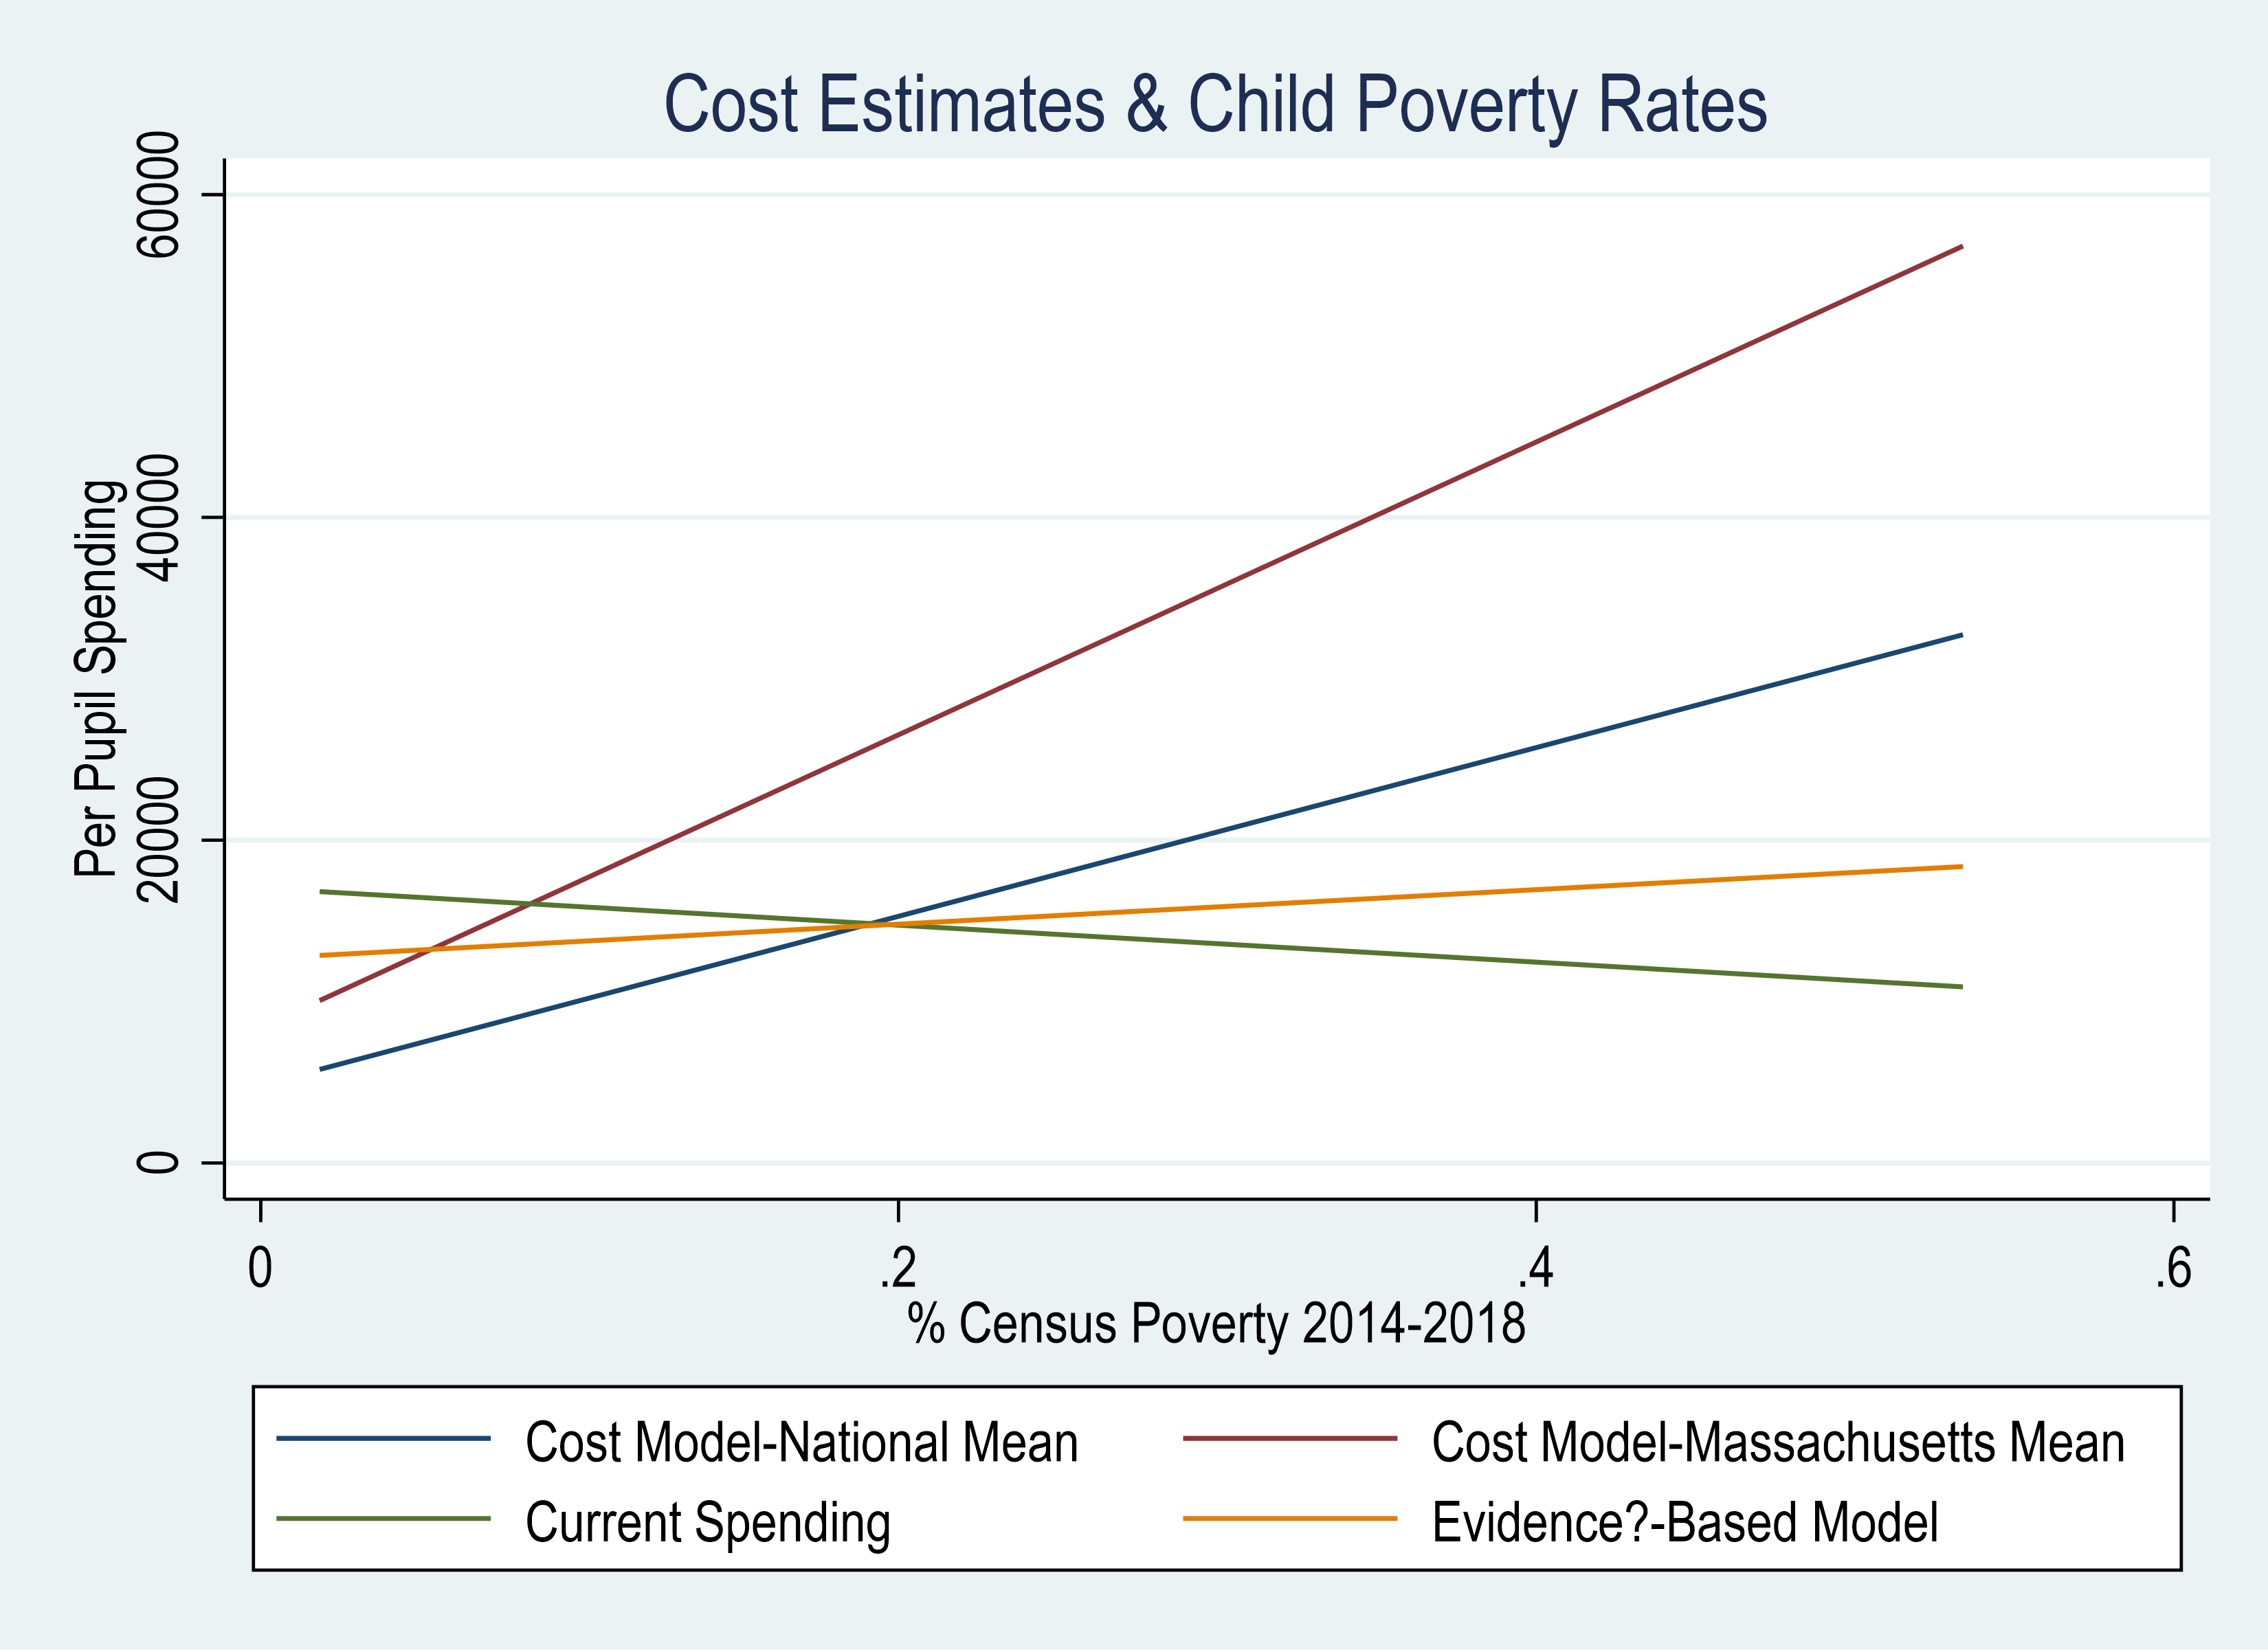
There are indeed variations across schools, within and across sectors, and those variations permit researchers to better understand what works, where, for whom and at what expense. Researchers and/or policy analysts tend to use either of two general approaches to study education costs, identifying spending levels that should generally be sufficient for achieving desired outcomes and identifying how education costs vary from one location to another across districts within a state and how those costs vary by the needs of varied student populations. One approach involves gathering focus groups of informed constituents to specify the inputs to schooling they believe are needed to get the job done. These professional judgment panels are essentially proposing a hypothesis of the programs and services needed under varied conditions and for varied student populations to achieve desired outcomes.

The preferred alternative is to construct statistical models which estimate the relationship between current district spending levels and current student outcomes, with consideration for various factors that affect the cost of achieving desired outcomes (student characteristics, district characteristics, labor market pressures) and with consideration for factors that influence whether districts are more or less likely to spend inefficiently.

This approach, called education cost function modeling has been used extensively in peer-reviewed studies of education costs and cost variation.[6]  As Tom Downes, an economist from Tufts University explained back in 2004:

“Given the econometric advances of the last decade, the cost-function approach is the most likely to give accurate estimates of the within-state variation in the spending needed to attain the state’s chosen standard, if the data are available and of a high quality” (p. 9).[7]

Since that time, data quality and access have improved significantly.

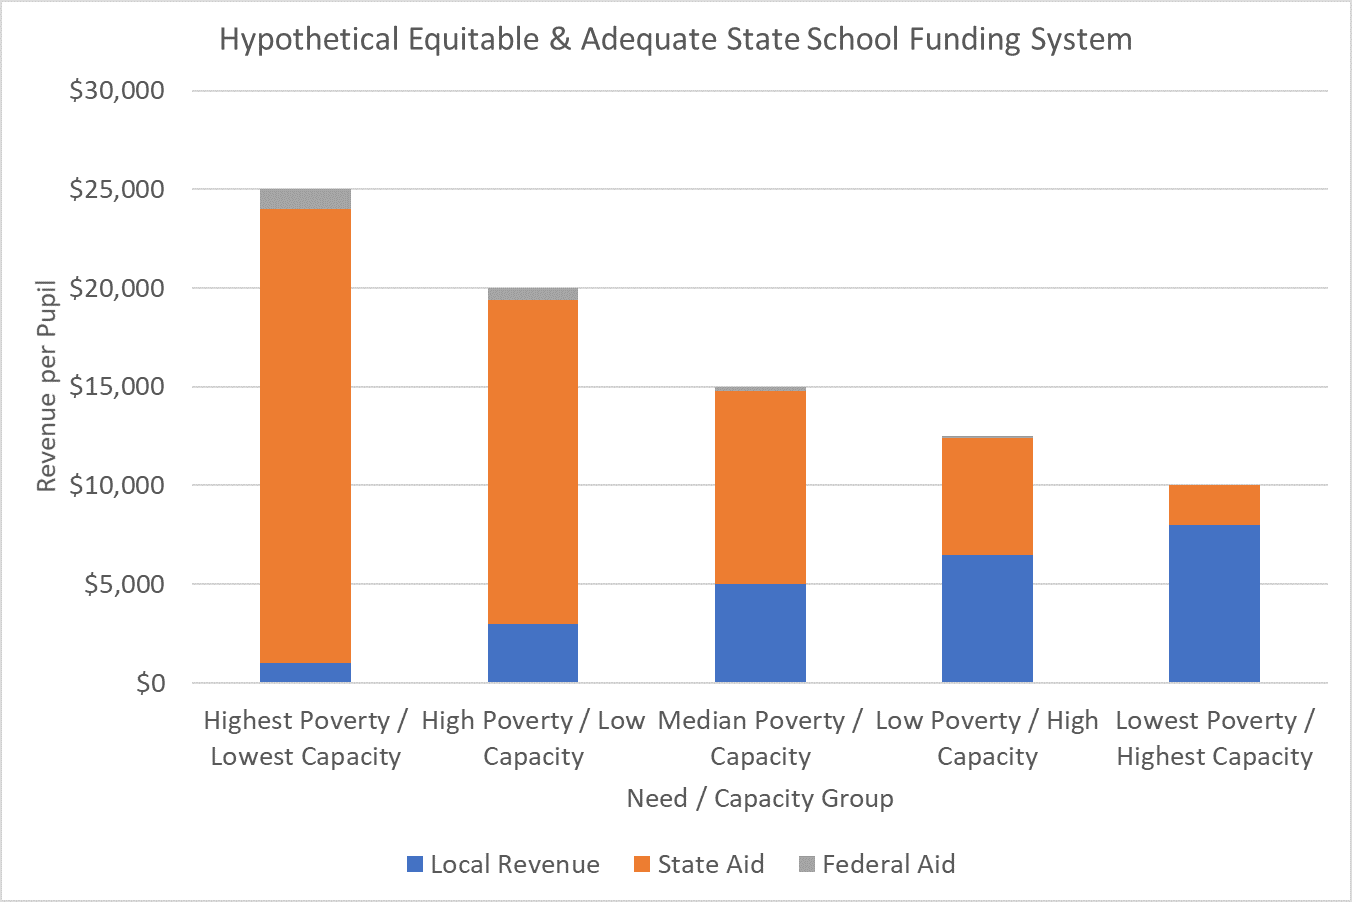
The goal of education cost modeling – or any form of cost analysis – whether applied for evaluating equal educational opportunity or for producing adequacy cost estimates is to establish “reasonable marks” to provide guidance in developing more rationale state school finance systems. Only with reasonable marks in hand can one make informed judgments as to whether existing policies are wide of those reasonable marks.

Historically, funding levels for state school finance systems have largely been determined by taking the total revenue generated for schooling as a function of statewide tastes for statewide taxation and dividing that funding by the number of students in the system. That is, the budget constraint – or total available revenue – and total student enrollment have been the key determinants of the foundation level, or basic allotment. To some degree, this will always be true. But reasonable estimates of the “cost” of producing desired outcomes, given current technologies of production (the range of practices actually used/tested), may influence the taste for additional taxes by revealing that the preferences regarding taxation and the preferences regarding desired quality of public education are misaligned, meaning that one or the other should be adjusted. That is, if we find out that higher outcomes are going to cost us more, we can then have a more reasonable discussion of whether we are willing to pay that amount more for the expected gain in quality, or whether to lower our expectations. Alternatively, we can simply fly blind.

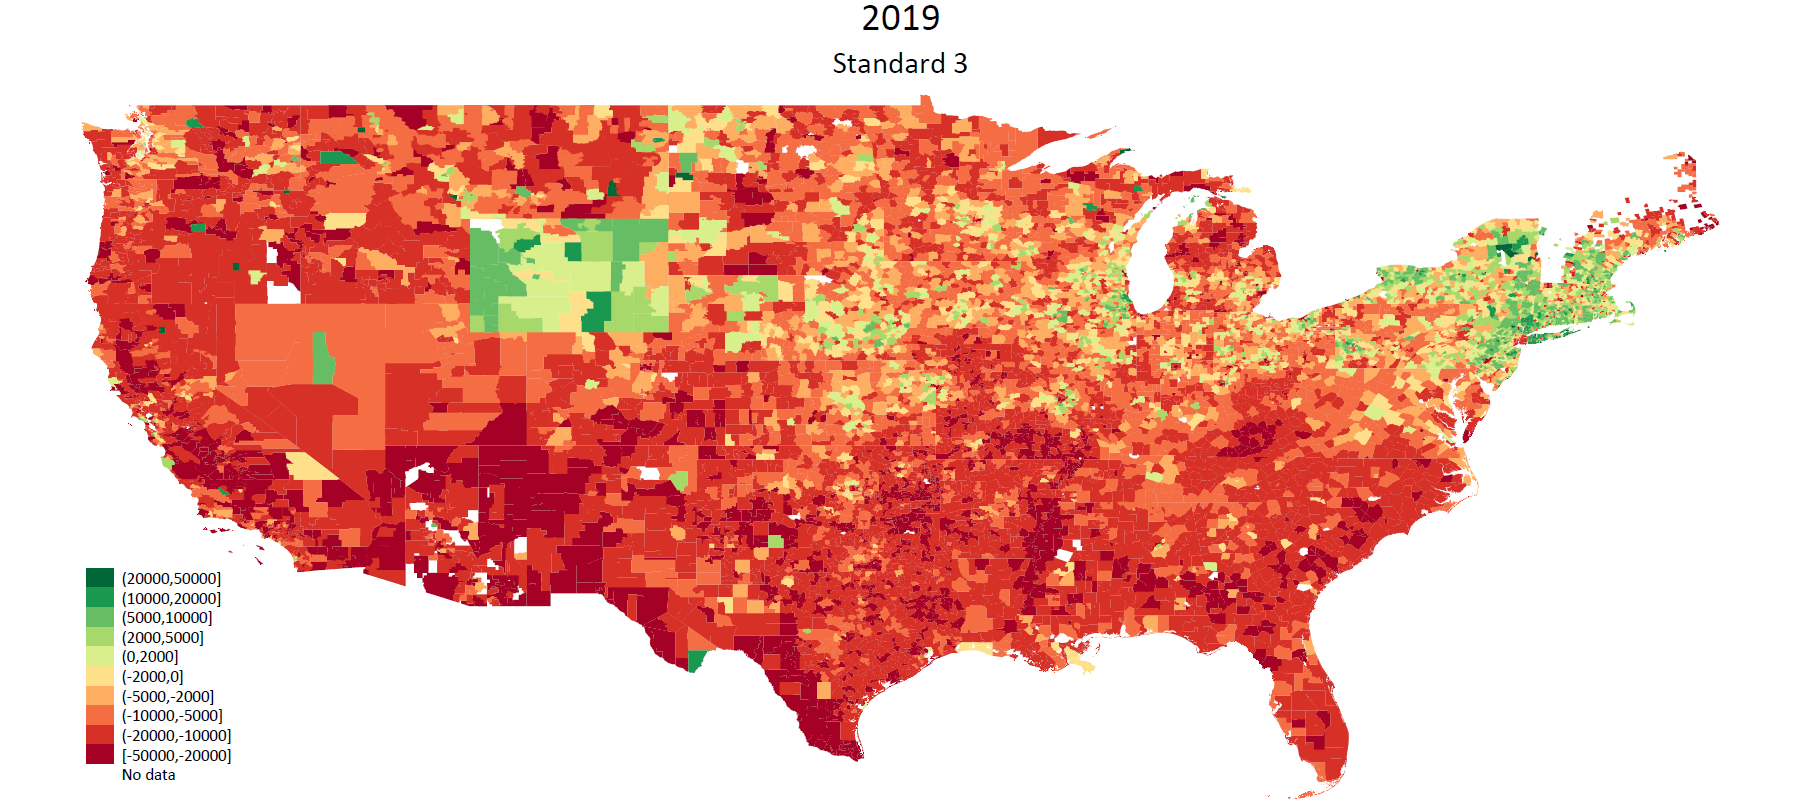
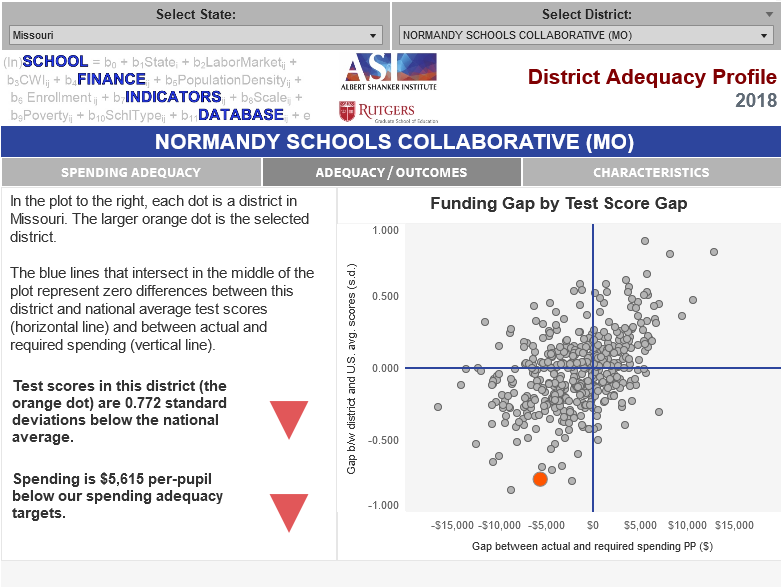
Reasonable estimates of cost may also assist courts in determining whether current funding levels and distributions are wide of a reasonable mark, or substantially misaligned with constitutional standards. Cost model estimates are not meant to be exact predictions of what student outcomes will necessarily occur next year if we suddenly adopt a state school finance system based on the cost model estimates. Cost models provide guidance regarding the general levels (predictions with error ranges) of funding increases that would be required to produce measured outcomes at a certain level, assuming that districts are able to absorb the additional resources without efficiency loss.

Studies of state school finance reform also suggest that the key to successful school finance reforms is that they are both substantive and sustained. If additional dollars to high need districts are best leveraged toward high quality preschool programs and/or early grades class size reduction, we are unlikely to see changes to college readiness outcomes the following year (or following five years). If the additional dollars are best leveraged toward increasing teacher salaries for teachers in their optimal years of experience, allowing districts to recruit and retain “better” teachers over time, we are also unlikely to see immediate returns in student test scores.

Importantly, cost model estimates are estimates based on the actual production technologies of schooling. They are based on the outcomes schools and/or districts produce under different circumstances, for different children – the actual children they serve, based on the actual assessments given, and based on the real conditions under which children attend school. Pure speculation that some alternative educational delivery system would produce better outcomes at much lower expense is certainly no basis for making a judicial determination regarding constitutionality of existing funding, and is an unlikely (though not unheard of) basis for informing statewide mandates or legislation.  Cost model estimates, as well as recommendations of professional judgment and expert panels can serve to provide useful, meaningful information to guide the formulation of more rational, more equitable and more adequate state school finance systems.


[1] Baker, B. D. (2016). Does money matter in education?. Albert Shanker Institute. https://files.eric.ed.gov/fulltext/ED563793.pdf

[2] Baker, B. D. (2017). How Money Matters for Schools. School Finance Series. Learning Policy Institute. https://files.eric.ed.gov/fulltext/ED606469.pdf

[3] Grosskopf, S., Hayes, K. J., & Taylor, L. L. (2014). Efficiency in education: Research and implications. Applied Economic Perspectives and Policy, 36(2), 175-210.

[4] https://schoolfinance101.wordpress.com/2017/09/10/reality-check-innovation-substitution-in-charter-private-schools/

[5] https://schoolfinance101.wordpress.com/2017/09/10/reality-check-innovation-substitution-in-charter-private-schools/

[6] Duncombe, W., Yinger, J. (2008) Measurement of Cost Differentials In H.F. Ladd & E. Fiske (eds) pp. 203-221. Handbook of Research in Education Finance and Policy. New York: Routledge.  Duncombe, W., Yinger, J. (2005) How Much more Does a Disadvantaged Student Cost? Economics of Education Review 24 (5) 513-532. Duncombe, W.D. and Yinger, J.M. (2000).  Financing Higher Performance Standards: The Case of New York State. Economics of Education Review, 19 (3), 363-86. Duncombe, W., Yinger, J. (1999). Performance Standards and Education Cost Indexes: You Can’t Have One Without the Other. In H.F. Ladd, R. Chalk, and J.S. Hansen (Eds.), Equity and Adequacy in Education Finance: Issues and Perspectives (pp.260-97). Washington, DC: National Academy Press. Duncombe, W., Yinger, J. (1998) “School Finance Reforms: Aid Formulas and Equity Objectives.” National Tax Journal 51, (2): 239-63. Duncombe, W., Yinger, J. (1997). Why Is It So Hard to Help Central City Schools? Journal of Policy Analysis and Management, 16, (1), 85-113. Imazeki, J., Reschovsky, A. (2004b) Is No Child Left Beyond an Un (or under)funded Federal Mandate? Evidence from Texas. National Tax Journal 57 (3) 571-588.

[7] T. Downes, What Is Adequate? Operationalizing the Concept of Adequacy for New York State (2004), http://www.albany.edu/edfin/Downes%20EFRC%20Symp%2004%20Single.pdf.

When Evidence Based Isn’t: Informing State School Finance Formulas to Provide Equal Educational Opportunity for All

First, a bit of review:

Goals of state school finance systems

  • The goal of state school finance systems is to provide all children, regardless of where they live or attend school, equal opportunity to achieve common, adequate outcome goals
  • Providing equal educational opportunity toward common goals costs different amounts in different settings, and across children (individually and collectively) by needs and contexts
    • State accountability systems set common goals and evaluate schools (and children) on whether they meet those goals.
    • A fair system requires funding sufficient to provide equal opportunity to meet these mandates (which are often used for articulating constitutional rights).

Two basic approaches to cost estimation

  • Input-oriented analyses identify the staffing, materials, supplies and equipment, physical space, and other elements required to provide specific educational programs and services capable of producing the desired educational outcomes for identified student populations being served in various settings.
  • Outcome-oriented analyses start with student outcomes that are generated by the programs and services offered by existing schools and districts. This type of analysis examines the relationship between spending on these programs and services and specific outcomes, while taking into account different student populations and the characteristics of the settings in which they are being served.

Limitations of Input-Based Approaches

  • As a general rule of thumb, input-based analyses (or input driven formulas) fail to capture the full additional costs to provide equal opportunity in high need settings, while often overstating the costs of meeting minimum standards in low need settings. In short, they tend to inflate the base and deflate the weights[1]
  • Differences in input-based approaches:
    • In one approach, panels of experts and practitioners are asked to populate templates of prototypical schools with resources they believe are needed to achieve a set of outcomes they’ve been provided.
      • Proposals of this type are useful but merely a hypothesis of what might be needed, lacking direct analysis of the relationship between those resources and outcomes
      • Panelists with experience in low need, well resourced districts are hesitant to suggest their districts (or prototypes like them) would need fewer resources to achieve less than they currently do, thus overstating base costs.
      • Panelists with experience in high need, but often under-resourced districts tend to underestimate the full needs/costs to meet outcome targets.
  • Supposed “Evidence-Based” approaches are even more problematic in this regard:
    • A single “evidence based” model of a prototypical school – designed to meet a state’s (in particular, every state?) specific outcome goals – simply doesn’t exist!
    • There is a dearth of evidence on staffing ratios, specific models and reforms to inform incremental differences in per pupil costs to achieve common (state adopted) outcomes.

Cost-Modeling is the only valid method for understanding cost variation with respect to outcomes

Put bluntly, outcome-based methods are the only methods which actually meet, or can meet the requirement of estimating costs associated with achieving common outcome goals.

  • Outcome based methods are the only methods which directly include the outcomes in question.
  • Outcome based modeling, or “cost function” modeling is also the only of these methods for which there exists a significant track record in peer reviewed literature, specifically around the question of understanding how much more or less it costs for one child versus another, in one location versus another toward achieving common outcome goals. [2]
  • Back in 2004, Tom Downes, an economist from Tufts University explained back in 2004: “Given the econometric advances of the last decade, the cost-function approach is the most likely to give accurate estimates of the within-state variation in the spending needed to attain the state’s chosen standard, if the data are available and of a high quality” (p. 9).[3] Since that time, data quality and access have improved significantly.

Informing state school finance policies with education cost models is a three-step process, but is relatively straightforward (more detailed policy briefs linked at each step).

  • Step 1: Goal Setting
    • Setting outcome goals and selecting measures of those goals for all students
    • Understanding the current position of students in the state with respect to outcome goals
  • Step 2: Modeling the cost of meeting goals
    • Using statistical modeling to understand the relationship between existing spending, students served, economic and geographic context, and outcomes attained.
      • Uses multiple years of actual data on school and/or district spending, outcomes, students and context to estimate spending associated with specific outcomes, under specific conditions.
        • Is state specific in terms of outcome measures, expectations and actual district spending and conditions
      • Using the fitted model to predict the spending associated with specific outcome goals (at average efficiency production)
  • Step 3: Translating cost model estimates to a weighted funding formula

How bad* are the results of an “evidence based” analysis?

*inequitable, inadequate and invalid

Unfortunately, it’s very easy with input-based analyses to advise state legislatures that they only need to do slightly more than they are currently doing, and that any new resources added to the system can be relatively evenly spread across schools, districts and the children they serve (meaning across political constituents). 

Consultants lose some control over this process when deferring to expert judgment panels. Consultants maintain the greatest control over their ability to tell legislators what they want to hear when using “evidence” based models, because the evidence simply isn’t there for specifying additional programs, services and staffing ratios associated with achieving common outcomes – and in particular, the state’s own outcome goals. The “evidence” is in the eyes of the “expert” consultant.

Figure 1 below compares a) current spending per pupil, b) the Illinois “Evidence Based” model per pupil costs, and c) two different cost model projections – costs to achieve national average outcomes and costs to achieve a higher outcome goal – Massachusetts average outcomes.

Presently, in Illinois (or at least historically), current spending per pupil has been systematically lower in higher poverty settings, despite substantial evidence that it costs more to achieve common outcome goals in higher poverty settings.[4] Illinois school finance has been “regressive” with respect to poverty. The Illinois “evidence based” formula adopted in 2017[5] conveniently suggests the need for only marginal increases in spending for the highest poverty districts, and only marginally above the average “cost” for much lower poverty districts.  It’s a politically palatable solution and it is better than the system it replaced. (a positive step for sure, after decades of none – but not at all what it claims to be!)

The new formula does not even come close to providing equal educational opportunity to achieve common outcome goals – especially in high need settings – whether low goals – like national averages on reading and math assessments, or higher aspirational goals like Massachusetts averages.

Figure 1.

Based on: FY22-Evidence-Based-Funding-Full-Calc (Final Adequacy Target per Student)

Table 1 puts some specific numbers on current spending versus cost targets from the state’s EB model and our National Education Cost Model. Sorted by poverty quintile, the Evidence Based model suggests only modest increases for the highest poverty quintile and does, on average, suggest that much lower poverty districts could get by with less than they presently spend.

But, the difference between the EB cost estimates for the highest and lowest poverty districts is only 22%. It is highly unlikely that the highest poverty districts could achieve common outcomes with the lowest poverty districts with only 22% additional funding. Typically, it would take more in line with 2x to 3x the per pupil funding to close these gaps, especially in a state with the extent of wealth and income inequality of Illinois. Less unequal states have less cost variation.

Compared against the low bar outcome standard of national average outcomes – an outcome exceeded on average in Illinois – the EB model underestimates costs by a modest but understandable margin. But the EB model especially fails to recognize just how little could be spent in the most affluent Chicago suburbs to merely achieve national average test scores. This is a political compromise and a political compromise paid for by reducing the additional “cost” estimate for high poverty districts. That is, depriving those children of equal opportunity!

Anyone who works with state legislatures to inform the reform of state school finance formulas knows that whatever comes out the back end of the political debate – whatever is eventually adopted – will involve political compromise. As I explain in my recent book on the state of Kansas, the goal is to toss the best possible empirical evidence into the political scrum such that what comes out the back side is “less bad than it might have otherwise been,” in the absence of that evidence.

Because of this, it makes little sense to throw into that political scrum, cost estimates that are pre-emptively politically compromised by expert consultants – based on what they believe legislators want to hear (and what we all know most of them do want to hear). Yes, nearly any state legislature wants two things in school finance reform: a) a revenue neutral solution and b) no losers. This is of course impossible, but many who advise state legislatures will find a way to tell them they only need to add a little more and they can spread it relatively evenly. This is rarely in line with valid estimates of equal educational opportunity and adequacy.

Table 1.

QuintileCurrent (2018)EB ModelECM National MeanECM Mass MeanCurrent Outcomes (Standard Deviations Over/Under National)
1-Lowest$16,347$12,771$6,899$11,9750.500
2-Low$16,492$13,340$8,844$15,3500.286
3-Middle$14,829$13,940$11,047$19,1740.000
4-High$15,219$14,405$13,062$22,671-0.149
5-Highest$14,517$15,525$17,815$30,921-0.365
Chicago$14,134$15,991$18,102$31,420-0.287
Wilmette$18,578$11,684$3,813$6,6190.862

Let’s take a look at where Chicago and Wilmette fall in our data visualizations of existing spending – compared to costs of national average outcomes – and actual outcomes. In short, just as the quintile average spending gaps above align with the outcome gaps (for our models, but not for the EB models), the City of Chicago is shown to fall in the lower left quadrant – spending less than needed to achieve national average outcomes (by several thousand per pupil) and fall below national average outcomes. By contrast, Wilmette spends well above what would be needed to achieve only national average outcomes, and far exceeds national average outcomes.

Figure 2
Figure 3

Validity Check

Here’s where it gets particularly fun. Here, I apply a validity check – a basic smell test – on the evidence based model compared to our national cost model. It would stand to reason that districts estimated to need more to achieve any specific outcome target likely currently fall below that target. Further, that districts with larger funding gaps would have larger outcome gaps – though an imperfect scatter.

The evidence based funding gaps – between 2018 per pupil actual spending and 2022 adequacy targets  – don’t comport even with this basic validity check. Yes, districts that far exceed the relatively flat cost estimates, do have much higher outcomes. But, there are nearly as many districts that were estimated to fall below their EB funding targets that already exceeded national average outcomes (upper left) as there are that fell below national average outcomes (lower left). And, as can be seen here, the EB model suggests relatively small, nearly the same increases in funding for the large number of above average outcome districts and below average outcome districts. This is simply nonsensical, unless you factor in that the recommendation itself – certainly the adopted version of it – is more political compromise than valid cost estimate. That is, the whole point was to argue some basis for giving lots of districts small  increases to politically appease, rather than providing what was actually needed to achieve common outcomes.

Figure 4.

By contrast, Figure 4 shows the relationship between our national cost model funding gaps and actual outcomes, Here, the relationship is much clearer (as it is in the data visualizations above). Districts with larger funding gaps also, not surprisingly, have larger outcome gaps. Because that’s what the actual connections – the underlying statistical relationships – in the data reveal.

Figure 5.

Why does this matter?

If the goal of a state school finance system, or the overarching state constitutional requirement is that all children shall have access to a basic set of prescribed inputs to their schooling, then input based methods absent outcome based validation may be appropriate. But this is rarely the case.

If states wish to impose common outcome requirements – standards and accountability – on public schools, as every state does and as federal statutes and regulations require – then states should be obligated to calibrate their funding formulas to provide all children equal opportunity to achieve those outcomes.

Anything less is inherently unfair and it is most certainly unfair to penalize children, their schools or teachers if appropriate, equitable and adequate funding, reasonably calculated to achieve those goals has not been provided.

It is irresponsible of those who should know better to continue to provide state legislators the political cover to continue depriving children – mainly low income black and brown children – equal opportunity to achieve common, adequate outcome goals.

We have common, widely accepted frameworks for understanding and evaluating equal educational opportunity and adequacy.

We have rigorous methods for estimating costs which comport with these frameworks.

Let’s use them and work toward not merely state systems, but a national system of public schooling that provides equal educational opportunity for all to achieve the outcomes we desire and they deserve.

Four Major Studies


[1] Baker, B. D. (2006). Evaluating the reliability, validity, and usefulness of education cost studies. Journal of Education Finance, 32(2), 170-201.

National Research Council. (2008). Common Standards for K-12 Education?: Considering the Evidence: Summary of a Workshop Series. National Academies Press.

[2] Duncombe, W., Yinger, J. (2008) Measurement of Cost Differentials In H.F. Ladd & E. Fiske (eds) pp. 203-221. Handbook of Research in Education Finance and Policy. New York: Routledge.  Duncombe, W., Yinger, J. (2005) How Much more Does a Disadvantaged Student Cost? Economics of Education Review 24 (5) 513-532. Duncombe, W.D. and Yinger, J.M. (2000).  Financing Higher Performance Standards: The Case of New York State. Economics of Education Review, 19 (3), 363-86. Duncombe, W., Yinger, J. (1999). Performance Standards and Education Cost Indexes: You Can’t Have One Without the Other. In H.F. Ladd, R. Chalk, and J.S. Hansen (Eds.), Equity and Adequacy in Education Finance: Issues and Perspectives (pp.260-97). Washington, DC: National Academy Press. Duncombe, W., Yinger, J. (1998) “School Finance Reforms: Aid Formulas and Equity Objectives.” National Tax Journal 51, (2): 239-63. Duncombe, W., Yinger, J. (1997). Why Is It So Hard to Help Central City Schools? Journal of Policy Analysis and Management, 16, (1), 85-113. Imazeki, J., Reschovsky, A. (2004b) Is No Child Left Beyond an Un (or under)funded Federal Mandate? Evidence from Texas. National Tax Journal 57 (3) 571-588.

[3] T. Downes, What Is Adequate? Operationalizing the Concept of Adequacy for New York State (2004), http://www.albany.edu/edfin/Downes%20EFRC%20Symp%2004%20Single.pdf.

[4] Duncombe, W., & Yinger, J. (2005). How much more does a disadvantaged student cost?. Economics of Education Review, 24(5), 513-532.

[5] https://www.isbe.net/Pages/EvidenceBasedFunding.aspx

Fixing the Vermont School Finance Mess

Bruce D. Baker, Rutgers University

PDF Version:

Purpose of state school finance formulas

The goal of modern state school finance formulas is to ensure that schools and districts throughout a state have the ability to provide their children equal opportunity to achieve common, adequate outcomes.  That is, by way of ensuring sufficient funding, providing that children regardless of where they live or attend school, or their own personal or family backgrounds are provided the resources they need to succeed – to be prepared for college or the workforce. The state’s own school accountability standards demand as much. To achieve a level playing field with respect to those standards, the state must calibrate school funding accordingly and deliver on that promise. Vermont has the information to calibrate such a formula, but has failed to deliver.

Vermont’s school finance system is upside down

Instead of guaranteeing that all Vermont school children are provided the resources they need to have equal opportunity to achieve some level of outcomes, the Vermont school finance formula provides local property owners equal ability to raise the funding that would be needed. But the choice is theirs. Further, without adoption of the weights we estimated in our 2018 report, taxpayers aren’t provided equal opportunity to raise sufficient funding to provide equal educational opportunities for their children. It makes little sense to try to fix this problem by simply attaching categorical grants as flotation devices to the upside-down system.[1] The system must be flipped and overhauled.

The bottom line is that it should not be a choice of local property owners whether they wish to uphold children’s state constitutional rights to equitable and adequate education.  If we take these state constitutional rights seriously at all, the state must guarantee that all districts have sufficient resources to provide their students equal opportunity to achieve a sufficiently high and broad set of outcomes. More importantly, it’s just the right thing to do.

How state school finance formulas are intended to work

State school finance formulas are generally designed to achieve two simultaneous goals:

  • Account for differences in the costs of achieving equal educational opportunity across schools, districts, and the children they serve (e.g., some districts serve larger shares of disadvantaged students than others).
  • Account for differences in fiscal capacity, or the ability of local public school districts to pay for the cost of education (e.g., their ability to raise local revenue, mostly via property taxes).

Municipalities and school districts differ with respect to the populations they serve, which manifests itself in differential needs for educational programming and services to offer similar opportunities to students (the first bullet). In addition, they vary widely in terms of wealth, which means their capacity to raise revenues through property taxes also varies widely (the second bullet). Often, although not always, these two factors are linked. That is, districts having less local taxable wealth are also likely to have higher concentrations of child poverty in their schools, and child poverty is a determining factor of the cost of providing children with equal opportunity to achieve common outcome goals.

What a state school finance system should look like:

Figure 1.

A well-designed state school finance system would begin by setting a need and cost adjusted target level of funding for each local public school district to achieve the first objective above. In most cases, that need and cost adjusted “foundation level” of funding is created by setting a basic funding level (the costs of achieving the desired outcomes in the lowest cost setting), and then applying weights and other “cost” adjustments to address the different costs associated with achieving a common set of outcome goals across settings and children. These weights and cost adjustments should be reasonably calculated toward these goals.

As shown in the figure, school funding formulas rely on layers of revenue sources, from local property taxes, to state aid derived primarily from a mix of income and sales tax revenues to federal aid derived from federal tax sources (such as income taxes). A downside of this layered system is that finding the “right” way to combine these revenue sources, and layered taxing decisions to achieve equitable funding is complicated. Property tax revenues across local communities are vastly inequitable for a variety of reasons. But property tax revenues are also a much less volatile revenue source and help to balance the public school revenue portfolio.

In a state school finance system like the one depicted above, the goal is to determine the “local fair share” or “local required effort” to be paid by local communities toward the cost target. This contribution is usually determined with respect to the taxable property wealth of the communities and income of taxpaying residents. For districts that do not hit their cost per pupil targets with local revenue alone, state aid is allocated to make up the difference (most districts fall in this category).

To date, the vast majority of federal aid has been allocated on the basis of child poverty concentrations through the Title I program. The effect of that formula is that larger slices of aid do tend to go to districts with both greater needs and costs and less local capacity of their own.

Doing school finance right in Vermont

One path, the most logical path, toward achieving equal educational opportunity through school finance in Vermont is to mandate that all local communities pay a common, wealth equalized local share toward funding the estimated costs of providing equal opportunity. Every measure needed for doing these calculations and implementing such a policy is already included in the 2018 UVM weighting study. In fact, we, as the authors of that study had to take additional steps to back out the upside-down logic of the way Vermont chooses to fund schools.

Our 2018 study generates empirical estimates of the per pupil costs to achieve statewide average outcomes, across every district in the state. We then convert those cost estimates into a weighted calculation formula. If that outcome is presumed sufficient, we can start there for setting the foundation level of funding needed in each district to achieve that goal, which is exactly what we did. Presently, some districts spend enough to achieve that goal and their students exceed that goal, while others do not. Actual spending compared to our cost targets, generated by applying our weights, looks like this (in 2018):

Figure 2.

On average, districts serving higher poverty student populations would need to spend more to provide equal opportunity. Notice that our simulated costs represented by orange dots tilt upward as poverty rates increase. But actual spending doesn’t. Because current spending per pupil across Vermont districts does not provide for equal opportunity. Children in the state’s highest poverty districts lack the funding necessary to provide them equal opportunity. That shouldn’t be a decision left to local communities, even if we provide them greater capacity to reach their cost targets. Rather, the formula should make sure they do reach those equal opportunity cost targets – that all Vermont children are provided equal educational opportunity. A different view is presented here, showing the differences between current spending levels and cost targets for equal opportunity:

Figure 3.

Children in Woodstock get to attend schools with well over what is needed for them to achieve merely state average outcomes. But children in Winooski, where the poverty rate is several times higher, would need an increase of over $10,000 per pupil simply to provide them equal opportunity to achieve state average outcomes. Even with our weighting adjustments – which would provide Winooski taxpayers the ability to raise those funds with comparable equalized tax rate – it’s not likely that Winooski would increase spending to reach their target. And thus, the children of Winooski would still be deprived of equal educational opportunity. It simply should not work that way.  The state should guarantee that the children of Winooski have the same educational opportunities as others across the state. The path to doing so is the path used in so many other traditional state school finance formulas, from New Jersey to Kansas.

  1. Use the UVM weighting study to calculate weighted per pupil cost of average outcomes for every district statewide[2];
  2. Mandate a minimum local contribution (equalized for wealth) and allocate state aid to fill the remaining gaps.

The evidence is already there

Where Vermont is ahead of other states is that Vermont has rigorously estimated targets, by the best and most appropriate methods available, of the spending levels needed to achieve state average outcomes. The model estimated in the 2018 UVM study can also be easily updated and can be used to simulate per pupil costs for every district to achieve higher or lower than current average outcomes.


[1] Duncombe, W., & Yinger, J. (2011). Making do: State constraints and local responses in California’s education finance system. International Tax and Public Finance, 18(3), 337-368.

[2] That number is available in the simulation: 64 – Total Funding PP (If distributed according to weights)

Featured

Toward a Unified Conception of Equity, Equal Opportunity, and Adequacy

Below is an excerpt from my 2018 book Educational Inequality and School Finance . In many ways, I think this one passage is among the most important in the entire book. Below, I’ve bolded a few sections I think are especially important. This passage builds on a chapter Preston Green and I wrote for the original Handbook of Education Finance and Policy (2008) in which we tried to develop a unified framework for understanding equal educational opportunity and educational adequacy. I’ve written in recent posts how it is absolutely necessary that conversations around reforming state school finance systems be guided by clear and consistent principles, which can be coherently linked to both legal frameworks and empirical analyses and models.

To put it bluntly, many of the methods being used and recommendations provided to state legislatures by “consultants” proclaiming their approaches to be built on evidence – to advance equity and adequacy – simply do not, nor can they ever meet the demands of this conceptual framework (and thus, certainly don’t stand up to judicial/constitutional scrutiny where equal educational opportunity and educational adequacy are demanded).

I’ll write more about these connections in future posts.

From Chapter 2

Because of the vast inequities that exist across our public school systems, legal scholars, advocates, and analysts have sought to develop conceptual frameworks and empirical measures to illustrate sources, causes, and consequences of such disparities in order to influence policy makers and guide courts in evaluating student and family rights.[i] In the post-Brown era it became increasingly apparent that dismantling of segregation would be a long and incomplete process. Further, even where greater integration was achieved, significant disparities persisted in the quality of schooling and available resources both across schools within states and across states. While racial integration remained a major national policy concern, resolving persistent, deep resource disparities across schools and communities gained momentum in the late 1960s and early 1970s.

In 1979 Robert Berne and Leanna Stiefel synthesized conceptual frameworks from public policy and finance and evidence drawn from early court cases challenging inequities in state school finance systems to propose a framework and series of measures for evaluating equity in state school finance systems.[ii] Their important work laid the foundation for subsequent conceptual and empirical developments regarding equity measurement applied to preK–12 settings. They used two framing questions: Equity of what? Equity for who? On the “what” side, they suggested that equity could be framed in terms of financial inputs to schooling, real resource inputs (such as teachers and their qualifications), and outcomes.

Their framework, however, predated both judicial application of outcome standards to evaluate school finance systems and the proliferation of state outcome standards, assessments, and accountability systems first in the 1990s and then in the 2000s under No Child Left Behind. The “who” side typically involved “students” and “taxpayers”: a state school finance system should be based on fair treatment of taxpayers and yield fair treatment of students. Drawing on literature from tax policy, Berne and Stiefel adopted a definition of fairness that provided for both “equal treatment of equals” (horizontal equity) and “unequal treatment of unequals” (vertical equity).[iii] That is, if two taxpayers are equally situated, their tax treatment should be similar; likewise, if two students have similar needs, their access to educational programs and services or financial inputs should be similar. But if two taxpayers are differently situated (homeowner versus industrial or commercial property owner), then differential taxation might be permissible; and, if two students have substantively different educational needs requiring different programs and services, then different financial inputs might be needed to achieve equity.

In recent decades, research has shown the shortcomings of horizontal and vertical equity delineations. First, horizontal equity itself does not preclude vertical equity; equal treatment of equals does not preclude the need for differentiated treatment for some (nonequals). Second, vertical equity requires value judgments that lead to categorical determinations of who is unequal and how unequal their treatment must be in order to be “equitable.” Differences in individual students and population needs don’t always fall into neat boxes; rather, they run along continua.

Nonetheless, laws—federal and state statutes and regulations—often try to put things into neat boxes, and conceptions of equity often intersect with legal claims that one group is not receiving equitable treatment when compared with another, thus requiring courts to consider how to remedy those inequities. Significant federal laws enacted in the 1970s operate under this model, applying categorical declarations as to who is eligible for different treatment and frequently requiring judicial intervention to determine how much differentiation is required for legal compliance.[iv] But most children do not fall into the categories set forth under federal (or state) laws, even though there exist vast differences in needs across those children.

An alternative, unifying approach is to suggest that the treatment is not the inputs the child receives but the outcomes that are expected of all children under state standards and accountability systems. In this sense, all children under the umbrella of these state policies are similarly situated and similarly expected to achieve the common outcome standards. Thus, the obligation of the state is to ensure that all children, regardless of their background and where they attend school, have equal opportunity to achieve those common outcome standards.

The provision of equal educational opportunity requires differentiation of programs and services, including additional supports—vertical equity. This input (and process) differentiation is toward a goal of equal treatment (treatment = outcome goals) rather than unequal treatment (treatment = inputs). Further, if differentiation of programs and services is required to provide equal opportunity to achieve common outcomes, there exists a more viable legal equity argument on behalf of the most disadvantaged children not separately classified under federal statutes. Whether children fit neatly into the protected boxes identified in federal statutes does not alone determine whether those children require additional resources. The conception of equal opportunity to achieve common outcome goals has thus largely replaced vertical equity in the vernacular of K–12 equity analysis.[v]

The late 1980s and early 1990s saw a shift in legal strategy regarding state school finance systems away from emphasizing achieving equal revenue across settings (neutral of property wealth) and toward identifying some benchmark for minimum educational adequacy. Some advocates for this approach saw it as politically infeasible for states to raise sufficient state aid to close the spending gap between the poorest and most affluent districts, meaning that achieving spending parity likely required leveling down affluent districts. Thus, a focus on a minimum adequacy bar for the poorest districts would alleviate this concern and potentially garner political support of affluent communities that no longer had anything to lose.[vi] Bill Koski and Rob Reich explain that this approach is problematic in part because minimum adequacy standards are difficult to define; also, when some are provided merely minimally adequate education but others provided education that far exceeds minimum adequacy, the former remain at a disadvantage. Further, the adequacy of the minimum bar is diminished by increasing that gap, because education is, to a large extent, a positional good,whereby individuals compete based on relative position for access to higher education and economic prosperity.[vii]

Others have adopted a more progressive “adequacy” view that focusing on state standards and accountability systems could hold legislators’ feet to the fire to provide sufficient resources for all children to meet those standards, and state constitution education articles could be used to enforce this mandate.[viii] Under this more progressive alternative, equal opportunity and adequacy goals are combined. The state must provide equal opportunity for all children to achieve “adequate” educational outcomes. Funding must be at a sufficient overall level and resources, programs, and services must be provided to ensure that children with varied needs and backgrounds have the supports they need to achieve the mandated outcomes.

It remains important, however, to be able to separate equal opportunity and adequacy objectives both for legal claims and for empirical analysis. The adequacy bar can be elusive.[ix] State courts are not always willing to declare that adopted accountability measures and outcome standards determine the state’s minimum constitutional obligation. The state’s ability to support a specific level of adequacy may be subject to economic fluctuations.[x] Importantly, at those times when revenue falls short of supporting high outcome standards, equal opportunity should still be preserved: equal opportunity can be achieved for a standard lower than, equal to, or higher than the single adequacy standard.[xi]

The practical implications of modern equity, equal opportunity, and adequacy conceptions are that state school finance systems must strive to achieve two simultaneous goals: account for differences in the costs of achieving equal educational opportunity (to achieve desired outcomes) across schools and districts and the children they serve; and account for differences in the ability of local public school districts to cover those costs. The first goal relates primarily to the sorting of students and populations by needs across local schools and districts, warranting substantial differentiation of funding to provide equal educational opportunity, as well as to geographic differences in the costs of labor and other school operations. The second goal stems from the continued reliance on local property taxation to support that system. Because local jurisdictions vary widely in the revenue they can raise when applying common tax rates or effort, states must distribute aid to offset these discrepancies, to achieve dollar parity. 


[i] This section draws on collaborative work with Preston Green of the University of Connecticut.

[ii] Robert Berne and Leanna Stiefel, “The Equity of School Finance Systems Over Time: The Value Judgments Inherent in Evaluation,” Educational Administration Quarterly 15, no. 2 (1979): 14-–34, doi:10.1177/0013161X7901500205; Robert Berne and Leanna Stiefel, The Measurement of Equity in School Finance: Conceptual, Methodological and Empirical Dimensions (Baltimore: Johns Hopkins University Press, 1984); Robert Berne and Leanna Stiefel, “Concepts of School Finance Equity: 1970 to the Present,” in Equity and Adequacy in Education Finance: Issues and Perspectives, ed. Helen Ladd, Rosemary Chalk, and Janet Hansen (Washington, DC: National Research Council, 1999), 7–33.

[iii] Berne and Stiefel, The Measurement of Equity in School Finance.

[iv] Regarding children with disabilities, see Endrew F. v. Douglas County School District Re-1, 137 S. Ct. 29 (U.S. 2016). Regarding children with limited English language proficiency, see Issa v. School District of Lancaster, no. 16-3528 (3d Cir. Jan. 30, 2017).

[v] Bruce D. Baker and Preston Green, “Conceptions of Equity and Adequacy in School Finance,” in Handbook of Research in Education Finance and Policy, ed. Helen Ladd and Edward Fiske (New York: Routledge, 2008), 203–21; Bruce D. Baker and Preston C. Green III, “Conceptions, Measurement, and Application of Educational Adequacy and Equal Educational Opportunity,” in The Handbook of Education Policy Research, ed. Gary Sykes, Barbara Schneider, and David Plank (New York: Routledge, 2009), 438–52.

[vi] William H. Clune, “The Shift from Equity to Adequacy in School Finance,” Educational Policy 8, no. 4 (1994): 376–94.

[vii] William S. Koski and Rob Reich, “When Adequate Isn’t: The Retreat from Equity in Educational Law and Policy and Why It Matters,” Emory Law Journal 56 (2006): 545.

[viii] For example, Kansas’s constitution requires that the legislature “shall make suitable provision for finance of the educational interests of the state.” Those educational interests are articulated in standards adopted by the state board of education, which holds independent constitutional authority for the “general supervision of public schools.” Kansas courts have repeatedly held that the legislature’s obligation is to provide financing that grants all children equal opportunity to achieve those standards. See Gannon v. State, 368 P.3d 1024, 303 Kan. 682 (2016); Gannon v. State, No. 113,267 (Kan. June 28, 2016); Montoy v. State, 279 Kan. 817, 112 P.3d 923 (2005); and USD NO. 229 v. State, 256 Kan. 232, 885 P.2d 1170 (1994).

[ix] Avidan Y. Cover, “Is Adequacy a More Political Question Than Equality? The Effect of Standards-Based Education on Judicial Standards for Education Finance,” Cornell Journal of Law & Public Policy 11 (2001): 403.

[x] Michael A. Rebell, “Safeguarding the Right to a Sound Basic Education in Times of Fiscal Constraint,” Albany Law Review 75 (2011): 1855.

[xi] Baker and Green, “Conceptions of Equity and Adequacy in School Finance”; Baker and Green, “Conceptions, Measurement, and Application.”


What does research say about Charter – District School Spending Differences?

Many of us are frequently bombarded with claims that district schools have a huge revenue and spending advantage over charter schools, and those claims are almost always cited to the same series of junk comparisons produced by the University of Arkansas Department of Education Reform. The authors of those reports would have everyone else believe that no other research has even been produced on the topic. Time and time again, the same authors have engaged in a circle of self-citation and reiteration of bogus findings from the same bogus and painfully amateur analyses – analyses that first and foremost fail to appropriately assign or attribute revenues allocated to the relevant children served, and second and equally problematic, fail to compare schools providing services of similar scope, to similar populations. I will provide a follow up post which explains the correct methods for making such comparisons. But first, what do real studies, performed by competent researchers find?

 Baker (yeah… that’s me, so some self-citation here), Libby, and Wiley (2015), in a peer-reviewed article, find that in Houston, the average charter school spent about $424 less than predicted and NYC charter schools were spending $2,000 more than predicted given their population characteristics.[i] That is, using models to compare otherwise similar schools, spending gaps vary by context, with modest spending gaps disadvantaging charter schools in Houston, but with charters holding a significant spending advantage in New York City.

More recently, Knight and Toenjes (2020), in a study of Texas charter schools, found “after accounting for differences in accounting structures and cost factors, charter schools receive significantly more state and local funding compared to traditional public schools with similar structural characteristics and student demographics.”[ii]

In a study completed on behalf of the Maryland Department of Education, authors from the American Institutes for Research (AIR) found:[iii]

“in all districts except Frederick, the predicted expense is less than the actual charter expense, indicating that average spending would be less for these charter schools if they followed the spending patterns of traditional schools in their district.”

That is, when modeled by regression analysis, given a variety of student and school characteristics, charter schools were spending more than expected (meaning, more than otherwise similar TPS).

Authors from AIR arrived at similar findings using similar methods in a study completed as part of the Getting Down to Facts project in California:[iv]

“The conditional analyses, accounting for student needs and grade configuration, show that average traditional and charter spending within our sample were not substantially different in 2014-15 and 2015-16. In 2016-17, Aspire schools were expected to spend $1,000 or more than traditional schools in both LAUSD and OUSD when controlling for student needs and grade configuration (Exhibit B). When special education spending was excluded, Aspire and Green Dot schools in Los Angeles spent more than otherwise similar traditional schools in Los Angeles.”

So, yes, the squishy bottom line in all of this is that it depends on the context, and also may depend on the charter operator within that context, depending on the types of children they serve as well as their access to supplemental resources. It is certainly NOT the case that charter schools are systematically shorted large amounts of funding compared to their district school counterparts serving otherwise similar populations in regular elementary, middle and secondary schools. The studies above include estimates of funding differentials in at least some of the same locations for which the University of Arkansas studies proclaim vast disparities.

The authors of these studies have been informed more than once, with detailed explanation as to why their methods are wrong and their findings incorrect, and with reference to studies, like those above which actually apply relevant, appropriate and standard methods. Instead of making any attempts to provide more accurate methods, or simply cease reporting, these same authors have made more and more egregious errors (see their latest on special education funding) leading to similarly erroneous – politically convenient – conclusions.

It’s either complete incompetence, or intentional deceit – or perhaps a little of both (see next post on correct methods for evaluating charter/district school – or any between school spending variations).


[i] Baker, B.D., Libby, K., & Wiley, K. (2015). Charter school expansion and within-district equity: Confluence or conflict? Education Finance and Policy, 10(3), 423-465.

[ii] Knight, D.S., & Toenjes, L.A. (2020). Do charter schools receive their fair share of funding? School finance equity for charter and traditional public schools. Education Policy Analysis Archives, 28(51), 1-40. Retrieved August 5, 2020, from https://doi.org/10.14507/epaa.28.4438

[iii] Levin, J., Baker, B., Atchison, D., Brodziak, I., Boyle, A., Hall, A., & Becker, J. (2016). Study of funding provided to public schools and public charter schools in Maryland. American Institutes for Research.  Retrieved August 10, 2021, from http://marylandpublicschools.org/stateboard/Documents/01242017/TabG-CharterPublicSchoolFundingStudy.pdf

[iv] Atchison, D., Levin, J., & de los Reyes, I.B. (2018). Study of spending in public charter and traditional schools in California. Making research relevant (p. vii). American Institutes for Research. Retrieved August 10, 2021, from https://gettingdowntofacts.com/publications/study-spending-public-charter-and-traditional-schools-california

School Finance 101: Methods for comparing school site spending (and correctly making charter school comparisons)

School finance researchers have been evaluating and comparing district- and school-level expenditures for decades, drawing largely on regression-based approaches which account for differences in needs and costs across settings, districts and schools.[i] With charter schools introduced into the mix over the past several decades, researchers have extended those methods to study differences in spending between district and charter schools serving otherwise similar student populations. The most thorough example, and specific application of this approach is the study conducted on behalf of the Maryland Department of Education in 2016.

Step 1: Matching the Dollars to the Students

The first step in the process is ensuring that the right revenues and expenditures (numerator) are attached to the right students (denominator) when calculating per-pupil resources. This is a fatal flaw – egregious error – repeated time and time again – in the often cited University of Arkansas Department of Education Reform charter funding gap reports. Where charter schools are fiscally dependent on public districts (as in most of the locations addressed by the authors), some revenues sent to and spent by districts are spent on services for children attending charter schools. If we leave those in the district’s funding numerator, but take those pupils out (as they are in charter schools) that overstates district per-pupil funding and understates resources to charter schools. Further, some district revenue sources may be dedicated to other services outside of their own schools—be they community services or students tuitioned elsewhere.

Step 1 is to get a comparable, comprehensive school site spending figure for both district and charter schools, likely excluding special schools or services (those served and the resources spent) from the comparisons. A detailed explanation of the process of achieving a comparable spending figure is explained on page 9, section 2 of the AIR study referenced in this report (http://marylandpublicschools.org/stateboard/Documents/01242017/TabG-CharterPublicSchoolFundingStudy.pdf).

Figure 1 is adapted from a report for the Maryland Department of Education, where the goal was to determine the “commensurate” expenditures of district and charter schools in that state. Maryland charter schools, like those in many states are fiscal dependents of local districts: they are funded by a pass-through system, where local tax revenues and state aid “pass through” the district and to the charter for each resident student enrolled. The district also retains responsibility for the direct provision of some services for charter schools, including transportation and system-wide enrollment management. While the Maryland report focuses on comparing charter and district school spending, its broader goal is establishing data standards and methods for better evaluating equitable allocation of resources across schools within districts, where that context includes a variety of “mission centers,” including charter schools.

As Figure 1 shows, the majority of public/taxpayer financing for the system goes first to the school district. Only a portion of that funding then flows to typical (“regular,” “traditional”) general purpose schools. Districts provide a wide array of services, including providing special schools, where necessary, for children with significant special needs, and alternative placements or schools for children removed from general purpose schools due to disciplinary actions (as is required in New Jersey). Often, students with significant special needs are placed in schools outside the district’s direct control; the district, however, still retains the financial responsibility and pays tuition for the student. Districts also provide an array of community services, make facilities available for community organizations, subsidize transportation and textbooks for private school children (in many states), and provide for transportation and special education supports for children attending charter schools (in many states).

Figure 1

Adapted from: Levin, J., Baker, B.D., Atchison, D., Brodziak, I., Boyle, A., Hall, A., Becker, J. (2017) Study of Funding Provided to Public Schools and Public Charter Schools in Maryland. Maryland Department of Education. http://marylandpublicschools.org/stateboard/Documents/01242017/TabG-CharterPublicSchoolFundingStudy.pdf

When evaluating resource equity across schools, the goal is to have as complete and comparable a measure as possible of the resources actually available to specific schools, based on the characteristics of students served in those schools. Doing so requires knowing not only which resources are assigned directly to individual schools – per Figure 1– but also identifying which other district services provide support to which schools, or provide support to activities that aren’t connected with individual schools – like providing community services. It would be inappropriate, for example, to take the total revenues received by the district, divided by the district’s own pupils, and compare those to the funding allocated to the charter school, divided by the charter schools’ pupils. This is because some of that revenue received by the district (even after subtracting direct transfers to charters) includes district spending on activities that serve charters, and funds obligated for support of private school students. District revenues allocated to special education schools, which serve student populations that differ substantially from those enrolled in charter schools, will operate at higher per pupil costs than charters.

These complications do not relate exclusively to comparisons between district and charter schools; they relate to any attempts to evaluate the equitable distribution of resources across schools within districts. Once we have isolated the comparable per pupil resources for all schools within a geographic space there will still exist important differences across student populations that must be accounted for when comparing school resources. This is true even when comparing the subset of “general purpose” district-operated schools and charter schools (most of which in New Jersey are “general purpose”).

Additional explanation provided in this report: https://www.njpp.org/wp-content/uploads/2020/11/NJPP-School-Funding-in-New-Jersey-A-Fair-Future-for-All-Part-5.pdf


Step 2: Modeling Spending Variation with Respect to Cost and Need Factors     

The second step is to use that comparable spending figure (spending per pupil, school site) as the dependent variable in a regression model which accounts for a standard, well-known and frequently used set of factors. This is the approach used in the Maryland and California studies, as well as several peer-reviewed articles evaluating school site spending variation (whether focused on charter schools or not). The standard model is:

Spend = f(% Low Income, %ELL, % SWD LI/HC, % SWD HI/LC, % Grades 6 to 8, % Grades 9 to 12, Geographic Location, Year, Control*)

That is, spending is modeled as a function of the share of children from low-income families (using a measure set to an income threshold sufficient to capture variation across schools), % who are English language learners, % students with disabilities preferably at least in two groups by severity, % in different grade ranges such as to compare schools of similar grade range, and if beyond a single metropolitan area, some geographic indicator to capture labor cost differences.  To determine whether charter schools are funded differently than TPS, one can include a dummy variable on charter status (control).

Table 1 provides an illustration with Maryland data. Table 1 shows that a school with 100% children from low-income families spends about $1,500 more per pupil than a school with 0% children from low-income families. A school with 100% ELL children spends only about $360 more than a school with 0% children who are ELLs. Special education populations, in the aggregate are by far the largest driver of spending differences with a school having 100% children with disabilities expected to spend nearly $22,000 per pupil more than a school with 0% children with disabilities. Notably, however as the share of those children with disabilities who are in the mild/moderate category increases, the overall spending margin decreases. Finally, charter schools are spending approximately $630 more per pupil than district schools—in the same district (fixed effect)—and serving otherwise similar student populations.

Table 1. Model of Maryland School Site Spending 2013-2015, Includes LEA Fixed Effect [schools weighted for enrollment. Estimated with Robust Standard Errors clustered on School]

 (1)
VARIABLESCommensurate Expense per Pupil
  
charter630.360*
(181.284)
% school enrollment in grades 6 to 8850.170*
(84.529)
% school enrollment in grades 9 to 12558.609*
(89.590)
Percent Special Education21,929.519*
(1,132.973)
% Students with Disabilities that are Non-Severe Disabilities-1,212.161*
(361.059)
Percent ESL358.567
(435.256)
Percent Low Income1,515.191*
(244.471)
year = 2014183.814*
(19.534)
year = 2015263.468*
(27.582)
Constant8,475.939*
(410.742)
Observations3,966
R-squared0.504
Robust standard errors in parentheses
* p<0.05

[i] Baker, B.D. (2009). Within-district resource allocation and the marginal costs of providing equal educational opportunity: Evidence from Texas and Ohio. Education Policy Analysis Archives, 17(3). Retrieved August 10, 2021, from https://www.redalyc.org/pdf/2750/275019727003.pdf

Chambers, J.G., Levin, J.D., & Shambaugh, L. (2010). Exploring weighted student formulas as a policy for improving equity for distributing resources to schools: A case study of two California school districts. Economics of Education Review, 29(2), 283-300.

Chambers, J., Shambaugh, L., Levin, J., Muraki, M., & Poland, L. (2008). A tale of two districts: A comparative study of student-based funding and school-based decision making in San Francisco and Oakland Unified School Districts. American Institutes for Research.

Atchison, D., Baker, B., Levin, J., & Manship, K. (2017). Exploring the quality of school-level expenditure data: Practices and lessons learned in nine sites. Office of Planning, Evaluation and Policy Development, US Department of Education. Retrieved August 10, 2021, from https://files.eric.ed.gov/fulltext/ED584614.pdf

Baker, B.D., & Weber, M. (2016). State school finance inequities and the limits of pursuing teacher equity through departmental regulation. Education Policy Analysis Archives/Archivos Analíticos de Políticas Educativas, 24(37), 1-36.

Baker, B.D., Libby, K., & Wiley, K. (2015). Charter school expansion and within-district equity: Confluence or conflict?. Education Finance and Policy, 10(3), 423-465.

Toutkoushian, R.K., & Michael, R.S. (2007). An alternative approach to measuring horizontal and vertical equity in school funding. Journal of Education Finance, 32(4), 395-421.

Kolbe, T., Baker, B.D., Atchison, D., Levin, J., & Harris, P. (2021). The additional cost of operating rural schools: Evidence from Vermont. AERA Open, 7. Retrieved August 10, 2021, from https://journals.sagepub.com/doi/pdf/10.1177/2332858420988868

Berne, R., & Stiefel, L. (1994). Measuring equity at the school level: The finance perspective. Educational Evaluation and Policy Analysis, 16(4), 405-421.

Stiefel, L., Rubenstein, R., & Berne, R. (1998). Intra-district equity in four large cities: Data, methods and results. Journal of Education Finance, 23(4), 447-467.

Stiefel, L., Rubenstein, R., & Berne, R. (1998). Intra-district equity in four large cities: Data, methods and results. Journal of Education Finance, 23(4), 447-467.

Knight, D.S., & Toenjes, L.A. (2020). Do charter schools receive their fair share of funding? School finance equity for charter and traditional public schools. Education Policy Analysis Archives, 28(51), 1-40.

School Finance 101: Child Poverty and State School Finance Formulas

There are days when I’m perplexed at how far we have NOT come in understanding (and conveying in policy circles) why we include measures of poverty and other student needs, along with a variety of “cost” factors in state school finance formulas. The theory and academic literature on this topic are well developed.[1] Some state legislatures have adopted school finance formulas with deeper, others not so deep understanding of these issues, just as some state courts have addressed these issues thoroughly while others have merely acknowledged their existence (others not at all). That is, that it is important, for some reason, to provide additional resources to schools and districts serving more children from low income families. Still, far too few legislatures or courts ask the key questions. Heck, too few of the consultants who advise them on a regular basis, or testify in court on these issues ask the right questions:

  • Why? Toward what end?
  • And how much will that really cost?

Most importantly, how do we get from A to B? And how do we use this information to reform state school finance policies?

The “Why” question is straightforward and embedded throughout every state’s education policy structures – primarily laid out in accountability systems (expressions of desired/preferred outcomes) – systems which dictate that all schools and districts must strive to bring their students to common outcome goals. These days, those common outcome goals are most often described in terms of College and Career Readiness, measured by interim assessments intended to predict whether a child is on track to succeed in college. 

Ideally, state school finance systems would be designed to provide sufficient resources such that all schools and districts could provide the programs and services necessary for all children to have equal opportunity to achieve those goals. And if the school finance system isn’t designed toward this purpose, the system is inherently unfair (most are).

So where does poverty fit into all of that?

Child Poverty is a form of “Risk” Factor

State policymakers often use the terms “at risk” and poverty interchangeably when talking about student need adjustments in their state school finance formulas. But they don’t often ask – “at risk” of what? And how does that relate to providing additional school funding, or how much funding? The tendency is just to say, well, they are “at risk” and we need to provide…oh… and additional 20 to 30% funding to help them out… you know, with a few extra school counselors and maybe some additional teacher aides in classrooms or something like that.

“At risk” is a useful term if we define “at risk of what?” And state policies already, in a sense, provide that, along with an empirical basis for evaluating it: At Risk of not meeting college readiness standards! (or whatever the desired common standards may be) More specifically, statistically less likely to meet these standards, all else equal.

So then, where does school funding come in? Additional resources are intended to mitigate (or equalize) the risk of not meeting those common standards!  In some states, this is actually the constitutional (court articulated) standard for evaluating the state school finance system- that the system must provide equal educational opportunity for all children to achieve constitutionally adequate educational outcomes.

In this context, poverty and poverty measures operate a bit differently than other student need factors in state school finance formulas. Other factors like children’s disability status, or having English as a second language are specific educational program needs of individuals, requiring specific programs and services assigned to those individuals who qualify for and require those programs and services. By contrast, school and district rates and concentrations of low income children, child poverty or other indicators of socioeconomic status capture a broader, community, schoolwide or districtwide need. We don’t (god forbid, I hope we don’t), for example, pull all the kids whose families fall just below the poverty income threshold and send them off to a separate room at 1:15pm every day to meet with the “at risk” counselor, hired with the money generated by the “at risk” weight. Rather, schools with higher poverty concentrations (compared to lower poverty concentrations), require broad based strategies in order to achieve that equal opportunity standard, compared with their more advantaged peers. What do I mean? Perhaps most importantly, high poverty schools need smaller classes (not just more counselors and aides), which means more teachers and classrooms and also likely need to pay a higher wage to recruit and retain teachers of comparable quality/qualifications.

Higher pay x More teachers = More money! (quite a bit more)

How much more? (there’s actually an article on that, using rigorous methods) Enough more so that kids in high poverty schools have equal opportunity to achieve the college and career readiness standards as their peers in lower poverty schools.

What poverty measure should we pick?

Given the framing above, the approach to picking the right measure of poverty as a “risk factor” is pretty straightforward. It’s not about identifying the individual child for some supposed educational need – programs and services – because his/her family falls below a certain income threshold, but rather about the extent to which school or district poverty rates increase “risk” that children don’t achieve the desired outcomes. So the measure you want to use is the measure which, at the district or school level, best predicts risk of not meeting the desired outcome standards? That is, the measure of child poverty, income status or whatever, that most tightly correlates with outcomes. Importantly, the measure which correlates strongly with outcomes across the full range of outcomes and economic status.

It can also be important to explore whether child poverty is associated with outcomes differently in small, remote rural districts and schools than in suburban or urban schools. If child poverty has different relationships to outcomes (different degrees to risk) at different concentrations or in interaction with other factors like population density.

Some cost benefit analysis can play into this. It may be that some measures are more cumbersome or costly to collect and update from year to year, and may perform somewhat better as predictors of outcomes, but not enough given the cost involved.

What then? How do we address the “how much? Question?

                The value of having:

  1. Valid conceptual framework (equal opportunity to achieve common goals), AND
  2. An empirical definition of “risk” and approach to selecting “risk factors”

…is that the next step – estimating the costs of mitigating those risk through state school finance systems flows logically into statistical modeling of the spending differences associated with achieving common outcomes at varied risk (poverty, income, whatever was selected) levels.

This next step – to follow “risk modeling” is “cost modeling,” and cost modeling sets out to very specifically estimate the costs of providing all children with what? Equal educational opportunity to achieve the desired, common outcome goals in question!  Cost modeling can then be used to directly inform the design of state school finance formulas including a) setting the overall level of spending needed in the average district to achieve the desired goals, and b) setting the weights and cost adjustments for a variety of factors (district size, competitive wage variation, student needs) to ensure that all children have equal opportunity to achieve those goals.

Using statistical models to relate risk and cost factors, to actual spending and outcomes – and, letting the data do the talking leads to the most accurate estimates – least political estimates – of the cost of providing equal educational opportunity. The relationships among the data are what they are, and are specific to each state context, measured outcomes and selected risk factors. Yes, there are judgments to be made in that process, by humans. But this process if far less subjective than a) asking local educators and other advisors what resources they believe they need to achieve a given set of outcomes (this is useful, but in other ways), or b) relying on consultants to provide their interpretation of what existing research says about how much (what staffing, programs, interventions) is needed to achieve the desired outcomes. Most of that research – even the best and most useful of it – was likely done in different contexts, toward different outcome measures. While it can be useful for making choices among, say, alternative reading programs, or other interventions, it is not particularly useful for estimating the costs of providing equal opportunity across lower and higher poverty settings.

The dangers of not having a guiding framework

In many states, the conversation has changed over time to adopt the logic and framework laid out here – that there is a connection between how we fund schools and what we expect of them. More broadly, that the state’s constitutional obligation to fund schools may be tied to the state’s obligation to ensure that all children have access to some common outcome goals, not just access to some equal dollar inputs to their schools.

When we – more importantly – when state legislatures (or courts) operate outside of or without any guiding framework, equal educational opportunity is unlikely to ever be achieved. It’s all well and good for state legislatures to let themselves feel progressive by saying – hey, we know kids from low income backgrounds need some more resources – so we’re gonna throw em’ a bone or two, and then to debate how they should count which kids get that bone and which don’t – sometimes picking the count method which requires buying the fewest bones, other times picking the count method which makes sure that those bones get spread most evenly – both being a political calculations. You can’t avoid political calculations. School finance formulas are political calculations.

But, when given a legitimate guiding framework and set of rigorous empirical methods for determining Who? Why? And how much?  We can hope to make school finance formulas better than they might otherwise be, in the absence of this framework and related empirical evidence. We can move the needle toward providing all kids equal educational opportunity to achieve common goals. But we’ve got to change the conversation in many places to get there!

============

My forthcoming book on Kansas will explain how the conversation changed in that state over time, and, as a result, why that state outpaces most of its neighbors in the region.

And these two recent reports apply the framework I outline here:

VERMONT

NEW HAMPSHIRE


[1] Baker, B. D., & Green, P. C. (2014). Conceptions of equity and adequacy in school finance. In Handbook of research in education finance and policy (pp. 247-259). Routledge.

Duncombe, W., & Yinger, J. (1999). Performance standards and educational cost indexes: you can’t have one without the other. Equity and adequacy in education finance: Issues and perspectives, 260, 261.

Charter Schooling in the Post-Espinoza & Fulton Era

Charter schooling is at a critical juncture and the future of charter schooling across US states can take either of two vastly different paths. On the one hand, charter schooling could become increasingly private, more overtly religious, openly discriminatory and decreasingly transparent to voters, taxpayers and the general public.  On the other hand, charter schooling could be made more public and transparent and be shielded from religious intrusion and all that comes with it. We recommend a policy framework which advances the latter and protects against the former.

We wrote in 2019 about transparency problems in charter school financial arrangements with related parties, and proposed regulatory strategies for mitigating these problems.[1] These problems have, over time, led to accumulation of large sums of risky, inefficient, high-cost debt for financing land acquisition and capital investment (school buildings). These are not practices which can be clearly assigned to for-profit and non-profit charter schools managers. Rather, they are practices common to both, and often involve poorly disclosed relationships between charter operators and related parties under either umbrella (FP or NP).

On what would seem to be a separate issue entirely, the US Supreme Court has recently opened the door more widely to overtly religious operators in the charter sector, declaring that when a state permits private actors to access public financing to provide an ostensibly public service, states may not exclude religious organizations from participating. Even more recently the court has also indicated that government has limited authority to regulate the practices of these institutions if those regulations conflict with their religious views. This includes regulations prohibiting discrimination on a variety of bases.  

The murkiness of the public-private distinction under state charter school laws creates a substantial vulnerability of the charter sector to become something it was originally argued to avoid – the public financing of religious education and indoctrination which dominated existing private school voucher programs at the time. Even prior to the Espinoza[2] and Fulton[3] decisions, religious operators had become significantly involved in the charter sector, in some cases adding to the opacity and of related party transactions over land and building deals between religious and secular private organizations.[4]

These two issues – a) the intrusion of religion and all that comes with it (discriminatory practices in the name of free exercise, religious curriculum including teaching of creationism[5]) and b) financial liability and transparency concerns – can be addressed by a unified overhaul of state charter school statutes and regulations.

First, Justice Breyer’s dissent in Espinoza acknowledges the variation in governing status of charter schools across states.[6] We note that there are two layers to this which include entities that authorize the establishment of charter schools and citizen boards that govern those schools. Either or both may involve non-government entities and private citizens and governing bodies. The latter (private governance of schools themselves) being more common than the former (non-gov’t agencies authorizing charters).  We argue first that both of these layers must be governed by state actors, involving elected or appointed boards, who, in this capacity are public officials (not private citizens or institutions).

Maryland provides one example which is sufficiently tight in this regard. Charter schools are authorized by, governed by and financed through their host county school districts. Further, while private management companies may be hired to “operate” the schools, employees of the schools are under county district contracts. That is, teachers and other certified staff in Maryland charter schools are public employees and themselves “state actors,” even when they work under the direction of a private management company. 

This model provides for increased public transparency, and at the same time, minimizes potential for religious intrusion on the charter sector. A truly public governing board (like the district board of education, appointed or elected) would not be able to exclude from management contracts, firms with religious ties or origins on that basis alone. But, given that instruction is provided by public employees and the school governed by public officials, the school would be bound by constitutional requirements regarding discrimination and the provision of religious curriculum (here, the establishment clause prohibits advancement or promotion of religion).

Fiscal transparency may be improved by requiring public access to detailed records on any contractual arrangements made between public officials governing the schools and private management or other private service firms (busing, food, communications/technology, etc.). Private firms seeking public contracts, religious or not, should be required to provide full financial disclosure of detailed expense reports, including annual independent audits. Religious organizations should not be shielded from these religion-neutral regulations when seeking publicly financed contracts.  Finally, this governance and regulatory structure would better enable public oversight of capital investment and acquisition of public debt, ideally shifting the majority of capital financing back to district and state governance and lower cost general obligation bonds.

Charter school advocates who have long favored the flexibility (and limited transparency, albeit unsaid) which charter schools have been granted under current state laws would likely resist this approach, arguing that it undermines the very basis of “chartering.”[7] But we argue that the sector is at a critical juncture, and failing to act may have long term detrimental effects, which more severely undermine the public purpose of charter schooling and democratic society writ large. A more optimal model is attainable, in which contract flexibility is accessible for charter schools, while keeping the schools and their employees truly public. Given the current legal and political environment, a new approach is necessary.


[1] https://theconversation.com/charter-schools-exploit-lucrative-loophole-that-would-be-easy-to-close-111792

[2] https://www.oyez.org/cases/2019/18-1195

[3] https://www.oyez.org/cases/2020/19-123

[4] https://www.wxyz.com/news/clark-durant-in-battle-with-pulte-trust-a-major-cornerstone-charter-funder

[5] https://www.huffpost.com/entry/school-voucher-evangelical-education-betsy-devos_n_5a021962e4b04e96f0c6093c?ufa=

[6] https://supreme.justia.com/cases/federal/us/591/18-1195/#tab-opinion-4267760

[7] https://www.publiccharters.org/sites/default/files/documents/2021-02/2021_model_law_ranking_report_rd3.pdf

Time to Tax the Churches!

On June 30th 2020, the U.S. Supreme Court determined that if a state has a program of providing public financing for private entities to provide educational services, that program cannot exclude from participation any institution simply because that institution is religious (see Espinoza v. Montana Department of Revenue). The decision involved a taxpayer financed tuition tax credit program providing vouchers for children to attend private schools, which under the state’s constitution (Blaine amendment), prohibited use of those vouchers at religious schools. This decision followed an earlier SCOTUS decision that prohibited Missouri from excluding religious institutions from access to a publicly financed program for playground refurbishing. These cases combined reverse a long history of state enforced Blaine Amendments which excluded the use of taxpayer dollars for religious institutions, even where taxpayer dollars were available to other private providers.

Of course, one difficulty with such provisions is having the government play any role in defining what is, or isn’t religion, when determining whether a tax benefit or public financing should be bestowed on an institution. Jedi? Religion! Church of the Flying Spaghetti Monster? Religion!

There are other examples where state governments bestow tax benefits on institutions simply because, exclusively and explicitly because of their status as “religious,” and regardless of other religion neutral criteria. These too have, to date, been upheld by established case law. But we argue that Espinoza which upended the established case law on Blaine Amendments also upends established case law on any state program which provides a tax benefit on the basis of religious status alone.

You ask – what could they possibly be talking about, and how could this be a big deal? Among other things, most if not all states provide for religious institution exemptions  from local property taxes. Churches, their often elaborate physical facilities, the land on which they sit is often exempt from property taxation by municipalities, school districts, etc., under state laws. Indeed, other types of institutions are also exempted in many cases, but churches and religious institutions are given their own separate status under these exemptions.

In New Jersey, schools and colleges, historical societies, libraries and other publicly held lands/buildings along with some service oriented non-profit organizations may quality for similar tax exemption, in accordance with religion neutral qualifications. Portions of land/buildings leased for to for-profit entities and/or for purposes not otherwise tax exempt may be subject to taxation. New Jersey law (NJ Rev Stat § 54:4-3.6 (2013) ) explicitly states: “all buildings actually used in the work of associations and corporations organized exclusively for religious purposes, including religious worship, or charitable purposes.”[1] Kansas law similarly provides explicit exemption for religious properties:

79-201. Property exempt from taxation; religious, educational, literary, scientific, benevolent, alumni association, veterans’ organization or charitable purposes; parsonages; community service organizations providing humanitarian services; electric generating property using renewable technology; landfill gas and production property.[2]

That is, religious institutions, regardless of whether they qualify on other religion-neutral grounds are granted exemption. Religious worship, per say, is presumed to be a non-profit community/public service, simply because it is “Religious,” even if that activity would not otherwise qualify.  

We are certainly not the first to raise this issue. But to reiterate, as much as these exemptions have been argued by some as absolutely untouchable as a form of religious freedom, or grudgingly untouchable by others as upheld in existing case law,[3] Espinoza changes all of this, and provides clear path toward taxing the churches.

If a state cannot exclude from access to taxpayer resources institutions simply because they are religious, a state also cannot exclude from taxation, institutions simply because they are religious. Indeed, to the extent that properties on which private schools operate are exempt, then this exemption would also apply to properties on which private religious schools operate. But the exemption would not extend to the church itself, or for example, rectories, religious retreats or other lands and buildings used solely for “religious” activities, including worship. The state cannot define religious activity in-and-of-itself to qualify as public service because the state should not be in the business of defining “religion,” and bestowing differential benefits on that basis alone.

Religion neutral exemptions for service oriented non-profits may include religion neutral regulations, such as non-discrimination requirements that may lead to the exclusion of some (if not many) religious institutions, including schools, from tax exemption. Such was the case in the revocation of non-profit status by the IRS of Bob Jones University. The Bob Jones case speaks to the broader point that religion in-and-of-itself cannot be classified by government as necessarily benevolent, thereby qualifying under a “benevolent neutrality” doctrine[4] (per non-profit qualifications). However, a recent SCOTUS decision raises questions about whether these regulations can be enforced. All the more reason to tax the churches.

Who pays the price for these unlawfully bestowed tax benefits? Other local property owners, who must pay higher taxes to offset the reduced overall tax base, and all other taxpayers in the state where state general funds are used to offset differences in local fiscal capacity. These taxpayers should, simultaneously, across multiple jurisdictions begin to file suit to recover these damages, and mitigate any future damages.


[1] https://law.justia.com/codes/new-jersey/2013/title-54/section-54-4-3.6/

[2] http://www.kslegislature.org/li_2014/b2013_14/statute/079_000_0000_chapter/079_002_0000_article/079_002_0001_section/079_002_0001_k/

[3] https://www.oyez.org/cases/1969/135

[4] https://www.oyez.org/cases/1969/135

Filling our Nation’s Funding Gaps

Mark Weber, Matt Di Carlo and I have a new report, with data and visualizations available over at schoolfinancedata.org. For that project, we take advantage of two major data sources to estimate a “cost model” for public school districts in the United States – specifically with the goal of estimating the per pupil costs (spending, controlling for differences in efficiency) to achieve a common outcome goal. We set that common outcome goal at the very modest level of existing national average outcomes on state assessments of reading and math achievement, grades 3 to 8. Yes, these are limited outcomes. Yes, this is a low bar. But, our main point here is to evaluate the disparities that exist across states and districts in the funding available, relative to the predicted costs, of achieving this modest target. Education cost analyses of this type have helped us better understand two things:

  1. It costs more to achieve higher outcomes than lower ones; and
  2. It costs more to achieve any given level of outcomes in some settings, with some children, than others!

State school finance systems state accountability systems for schools have historically been disjoint. On the one hand, we use state assessment data and other outcome measures to declare schools or districts good or bad – exceptional or failing. But rarely do we design and implement school funding systems that are actually built upon estimates of a) the costs of achieving the desired outcome levels, on average, or b) how those costs vary from one setting and child to the next. That is, we don’t design state school finance systems to deliver the funding that would provide each school or district with equal opportunity to hit the targets we set in state accountability policies. Thus, we necessarily create an unfair playing field. This is true in every state, though some more than others. We’ve rarely even considered how these disparities play out across states. That is, whether children in Mississippi should have equal opportunity to achieve outcomes similar to children in Massachusetts, and what that might cost.

Here’s what those funding gaps look like with respect to costs to achieve national average outcomes, for 2019, based on a model fit to data on spending, outcomes and various other school and district characteristics from 2009 to 2018.

Here’s what the outcome gaps look like in 2018:

In other words, the outcome gaps line up largely with the funding gaps. Where states, schools and districts spend enough to achieve average outcomes, they generally do achieve those outcomes. It’s not a perfect relationship, but it is a clear one. Further, deviations from this relationship occur for a few different reasons – some of which we suspect are a result of data which simply aren’t fully comparable – fully equated from one state to the next.

Still, these data give us a pretty good picture where in the country and within specific states we need substantially more investment in schooling to achieve even modest outcomes. To put these gaps into context, in 2021, the total sum of money needed to fill the red in the first map is about $130 Billion! While that seems huge, and is, it’s also about the same amount of money included in the new federal stimulus package for schools. But, a) that stimulus package is spread over a few years, to be obligated by fall 2024 (perhaps spend and spread out over even longer) and b) not permanent. It will go away, when what we really need is a sustained increased investment.

It is important to understand though, that states – especially those which currently put up very little effort of their own, should have to share some of the cost of closing these gaps. The needed increase in federal aid to close these gaps would be significantly reduced by requiring all states to put up their fair share and allocate aid to local districts appropriately according to need. This figure, from our visualizations on the site shows that states which put up more effort to fund their schools tend to have more adequate spending. Shocking, I know!

It’s also important to understand that if we want to shoot higher, it’s going to cost more. A lot more. Here’s what the funding gaps look like if we shoot for current Massachusetts average outcomes:

Let’s take a relatively average state, for example, like Missouri. An average state, but one with extremes. I had the pleasure of speaking to school administrators in Missouri about a week ago. On average, school spending per pupil across Missouri school districts really doesn’t vary much by poverty. The funding is not progressive. And on average, it’s relatively average.

St. Louis and Kansas city have somewhat elevated funding, but high poverty districts overall, not so much. If we compare these current expenditures to costs of achieving national average outcomes, we have …

That is, to provide equal opportunity to achieve national average outcomes, which aren’t too different from Missouri average outcomes would take doubling or more the per pupil spending of low spending high poverty districts, but low poverty districts could actually spend less, quite a bit less to achieve national average outcomes (which are much lower than their current achievement). For example, from our new visualizations… Clayton, an affluent suburb of St. Louis spends well above what it needs to achieve merely national average outcomes, and far exceeds those outcomes.

By contrast, right down the road… Normandy schools have significant gaps in spending and outcomes.

A few additional points which aren’t included in our new reports and site are a) how much more it would cost to achieve higher outcomes and b) the influence of racial isolation and segregation on costs. First, here’s how much the cost targets go up in Missouri if we shoot for Massachusetts average outcomes:

Shooting for Mass average outcomes, only Missouri’s lowest poverty districts currently spend enough to achieve the target and the per pupil costs for the state’s major cities climb to over $35,000 per pupil.

Prior research has shown that if we include racial composition directly in these models we may get different cost projections and thus funding gaps. Specifically, black population concentration resulting from structural, systemic racism, housing and school segregation can lead to even higher costs of mitigating outcome disparities.

If we re-estimate our models to each standard, with and without racial composition (in this case, % black enrollment) we get these results. For Normandy, for example, the non-race model (which we use in our new report) estimates a cost of national average outcomes in 2018 of $18,774. But, when racial composition is considered, Normandy which is a nearly 100% black school districts, has costs per pupil of nearly $26,000 to achieve national average outcomes.

These issues require further exploration and integration into what Preston Green and I have recently laid out as a reparations framework for school finance. Racial composition, as in our past work, continues to significantly affect the cost of achieving common outcome goals. Because of this, it remains a significantly unfair playing field to rate and rank districts on outcome metrics, when we have failed to fully address these different costs. It’s also simply unfair to the children subjected to these conditions and a constitutional violation under many state constitutions to deprive these children of equal opportunity to achieve common, adequate outcome levels.

Our new project is intended to help users, policymakers and advocates better understand these need and cost differences. Our focus is on the relative position of districts and states in the mix. And again, we are estimating against a low bar. It should not be construed that this bar – the outcome basis for our estimates – constitutes constitutional educational adequacy in any state’s particular context. States have their own standards. State courts have in many cases determined whether those outcome standards determine the constitutional standard and by extension the legislature’s obligation to finance districts to meet those standards. But many states, courts and legislatures have ducked these questions altogether over time. And we’ve never really had a robust national discussion on what it might take to raise the bar nationally, and where we have the furthest to go.

Here, we offer a starting point and one that hopefully helps change the conversation, and guide future federal aid programs as we move to the post-covid era!