As with the Vergara case in California, a central claim of the New York City Parents Union is that the presence of statutory tenure protections in New York State leads to a persistent and systematic deprivation of a sound basic education which falls disproportionately on the state’s low income and minority children.
Let’s review again the basic structure of this argument. The argument challenges state statutes that impose restrictions on district contractual agreements pertaining to procedures for evaluation and dismissal of teachers once they achieve “tenure” or continuing contract status.
The argument goes – within districts, minority and low income are disproportionately assigned the “least effective” teachers.
Within districts, minority and low income children are disproportionately affected by assignment of the least qualified teachers, including novice teachers and those not classified as “highly qualified.”
And this occurs because of statutory definitions of and job protections pertaining to “tenure.”
Now, to the extent that substantive disparities of the types mentioned above exist, the next trick is to show some connection to the laws in question.
These laws are presumed to affect all districts which operate under them similarly.
If these laws are unchanged over time, it is presumed that districts have little room to affect positive change in the distribution of teacher attributes when operating under these laws.
If a similar or greater share of variation in teacher attributes actually exists across districts (across separate teacher contracts) as opposed to within, then it is likely that some other factors are playing into the disparate assignment of teachers, including the sorting of teachers as they apply for jobs on the labor market, considering variations in working conditions and compensation.
Unless of course, we are arguing this case in the offbeat world of VergarNYa.
Let’s take a look at the actual data on NYC and NY state (NYC Labor market) teachers to see just how badly the actual data might undermine plaintiffs arguments before their case even gets off the ground.
For the following analyses, I’ve mined three sources of data which I have available at my fingertips because of previous projects:
- NYC Value Added estimates publicly posted in 2012.
- New York State Personnel Master File (teacher credentials and compensation)
- New York State School Report Cards (school demographics)
Do Low Income and Minority Children within NYC have the Least Effective Teachers using the City’s Own VAM Estimates?
I’ve explained previously the problems with using “effect” ratings themselves in determining equitable distributions, since we can’t always tell whether the distribution of teacher “effect” are inequitable, or biased. That is, do we appear to have more “bad” teachers in high poverty schools or are teachers getting bad ratings in part because they work in high poverty settings?
I’ve also explained previously, that while the New York State (NYSED) growth percentile scores tend to be significantly biased, by poverty and other demographic characteristics, New York City’s more refined Value Added Model produces significantly less bias. You might say – ah… that’s good… and in some ways it is. But it certainly doesn’t help the VergarNYa arguments, does it?
For example, Figure 1 below shows the demographic characteristics of NYC schools of the Upper Half of teachers by Value Added Percentile and the Bottom Third of teachers – among those in the upper half or bottom third for three consecutive years:
Figure 1.
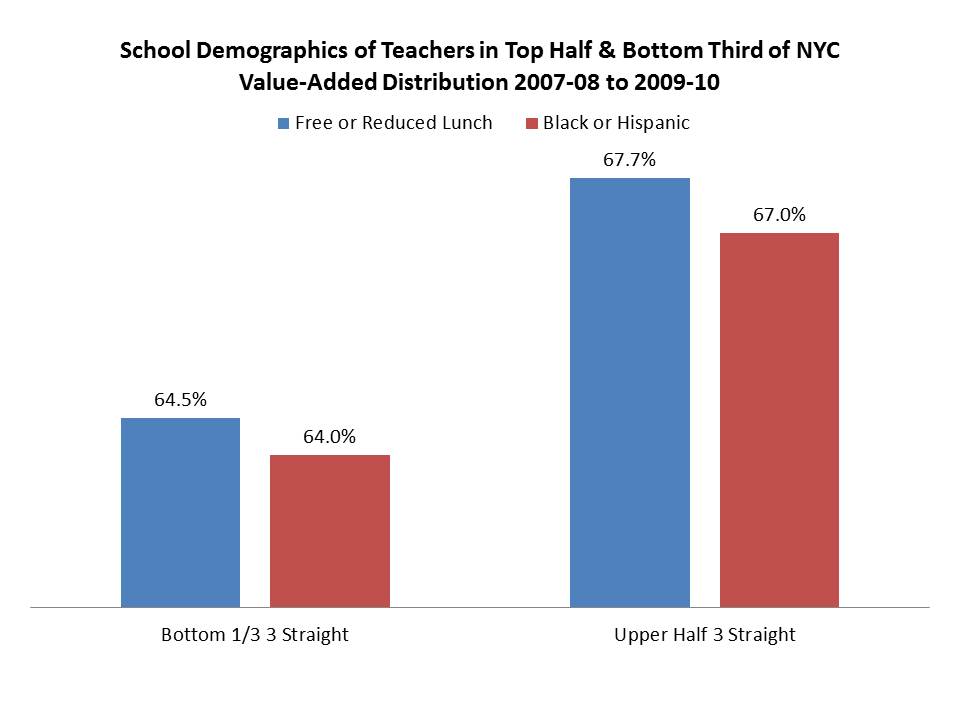
As it turns out, the percent black or Hispanic, and the percent free or reduced priced lunch is actually higher, on average, in schools of the teachers in the upper half.
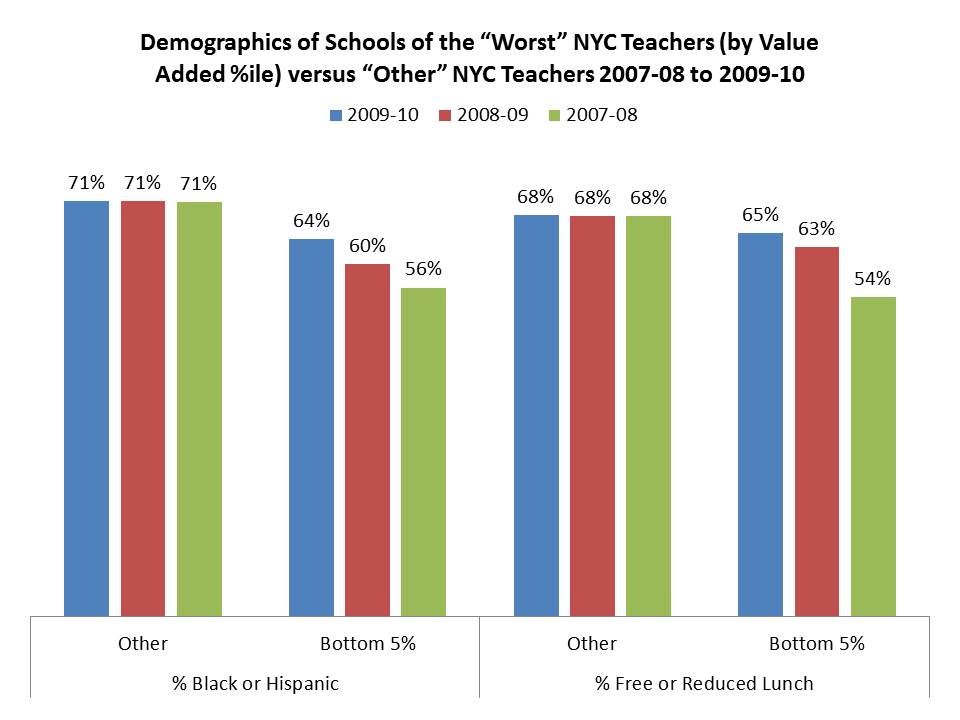
Ah… but you say, what about the really really really bad bottom 5% of teachers? What are the demographics of their schools? Well, again, comparing the bottom 5% to all others, the bottom 5% are in schools with a) lower shares of low income children and b) lower shares of disadvantaged minorities.
Figure 2.
Are the Odds Greater that Low Income or Minority Children within NYC have Less Qualified, or Novice Teachers?
Well, then, since our indicators of teacher “effect” aren’t sharply disparately distributed, unless we used the state’s biased measures, what about more traditional attributes of teachers – like concentrations of novice teachers, or state policy designations, like “highly qualified?”
The next figure is based on logistic regression models evaluating the relative odds that a teacher in a school with X% versus X+1% low income or disadvantaged minority students is novice or not, or highly qualified or not. The models focus on New York City schools again. Figure 3 shows us that:
a) There is little if any shift in the likelihood that teacher is novice when % free or reduced priced lunch is higher, or when % black or Hispanic is higher.
b) There is a slight uptick (small but statistically significant, in part because we have such a large data set) in the likelihood that a teacher is novice as % black and Hispanic population increases, coupled with a slight decrease in the likelihood that a teacher is highly qualified.
- The uptick amounts to a <1% increase in likelihood that a teacher is novice for each 1% increase in % black and Hispanic population;
- The decrease amounts to about half of one percent in the likelihood that a teacher is highly qualified for each 1% increase in % black and Hispanic population.
Figure 3.

So, we do have some disparity here. That said, it’s still a heavy lift to suggest that a) this disparity rises to a level of substantial constitutional deprivation and even heavier lift to suggest that b) state teacher tenure laws have anything to do with the presence of this disparity (the apparent inability of the district to reshuffle teachers to negate this relationship between novice teacher concentration and student minority concentration).
The next figure evaluates total teaching experience using a regression model to parse the relationship between school demographics and average total years teaching. And this figure shows that for each additional 1% low income population, teacher experience… well… doesn’t really change. For each 1% additional disadvantaged minority population, teacher experience declines by 5% of one year.
Figure 4.
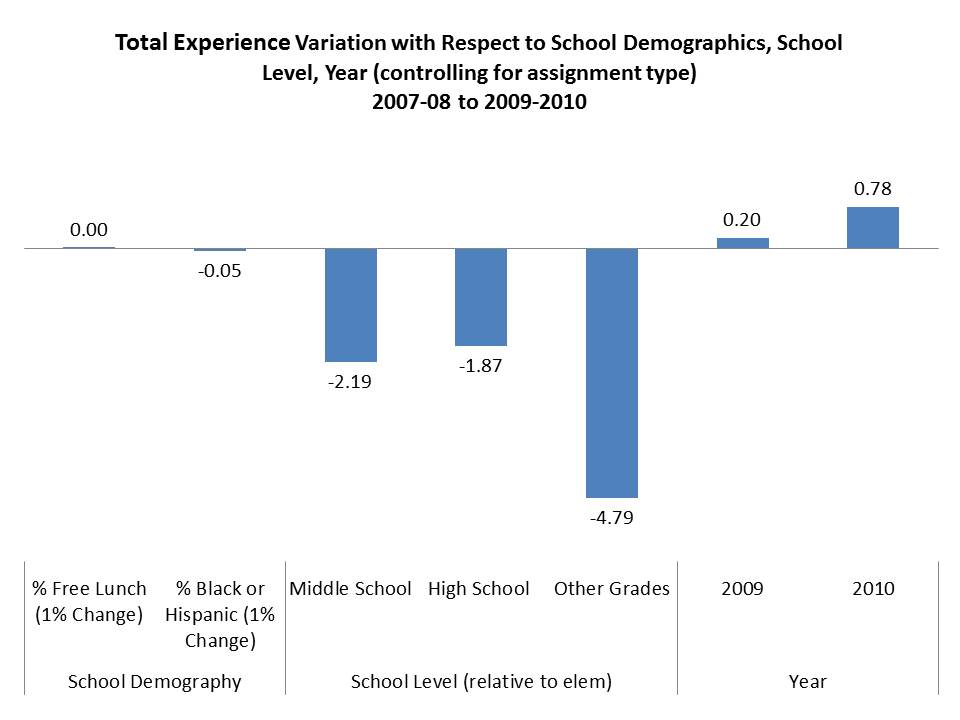
Again, we have some disparity with respect to minority concentration… but again, it’s one heck of a stretch to assume causation between state teacher tenure laws and differences of 5% of one year in average experience of teachers associated with each 1% change in percent minority student concentration.
Is this really a within district/within contract problem?
As I’ve pointed out in my previous two posts, the presumption that a major cause of teacher quality disparity affecting low income and minority children is state statutory protections of due process in dismissal cases, relies on substantial disparity in teacher attributes across schools within districts, as opposed to across districts. The idea, as expressed by the various local administrators in California who took the stand at trial, is that their hands are tied. They have no other choice because of the shackles of tenure and seniority protections, to keep bad teachers in low income and minority schools, and of course, keep good teachers in their less low income, less minority schools. It’s not their fault. It’s the law [a baffling admission indeed…].
But it’s quite possible that in fact, the major cause of disparity in teacher attributes disparately affecting low income and minority children lies in the ways teacher sort on the labor market – across districts – thus across contracts – and not within districts by leveraging state law to their defense and advantage.
How then, do student population characteristics compare for novice teachers and highly qualified teachers across versus within New York State districts? Figure 5 compares the demographics of schools of Novice teachers within NYC and within the NYC metro area, across districts.
Figure 5.

Figure 5 shows us that the disparities in populations are much greater across districts than within NYC.
- The % black or Hispanic population is about 15% higher in the districts of novice teachers than those who are not novice.
- The % low income is nearly 10% higher in the districts of novice teachers than those who are not novice.
- By contrast, within NYC, the percent black or Hispanic is about 7% (half the between district disparity) higher in schools of novice versus non-novice teachers, and the percent low income is between 1 and 2% greater in schools of novice teachers.
Do districts really have no ability to leverage change?
Finally, as I explained in my previous post, there already exists a substantial body of literature which severely undermines the assertion that local public districts in New York simply have no way to resolve teaching inequality across student populations. Most specifically, this one piece by Boyd and colleagues validates that New York City in particular made significant strides in the early 2000s at improving what had been far more substantive gaps in teacher attributes.
The gap between the qualifications of New York City teachers in high-poverty schools and low-poverty schools has narrowed substantially since 2000. For example, in 2000, teachers in the highest-poverty decile of schools had math SAT scores that on average were 43 points lower than their counterparts in the lowest-poverty decile of schools. By 2005 this gap had narrowed to 23 points. The same general pattern held for other teacher qualifications such as the failure rate on the Liberal Arts and Sciences (LAST) teacher certification exam, the percentage of teachers who attended a “least competitive” undergraduate college, and verbal SAT scores. Most of the gap-narrowing resulted from changes in the characteristics of newly hired teachers, rather than from differences in quit and transfer rates between high and low-poverty schools.
Boyd, D., Lankford, H., Loeb, S., Rockoff, J., & Wyckoff, J. (2008). The narrowing gap in New York City teacher qualifications and its implications for student achievement in high‐poverty schools. Journal of Policy Analysis and Management, 27(4), 793-818. http://cepa.stanford.edu/sites/default/files/Narrowing.pdf
And so it goes…. In the land of VergarNYa… a world where logical fallacy rules the day and where empirical evidence simply doesn’t matter…

While I don’t have statistics to back up my claims, this is what I have observed in the Buffalo Public Schools (Buffalo being the second largest city in NYS):
Every year there are openings in the schools based on retirements and/or on new programming (such as hiring Reading Coaches to work with the faculty on reading instruction). Every year teachers are allowed to put in a transfer request. According to seniority, the teachers may either select a school to transfer into or stay put at their old school (if they don’t like the available choices). After that, the new teachers are placed. There is also input from the principals affecting staffing, so that some newer teachers are immediately placed in one of the better schools.
So yes, often the only options available are at the lower achieving, higher poverty, larger minority schools. You would be surprised, however, at how many teachers stay put at these schools. The faculty becomes like a family and they are dedicated to their students. Usually the only reason they would transfer out is because they have a difficult principal. (Believe it or not, I can tell how good a principal is by how many of the staff leave the year they begin as administrators in a particular school. This is also a good way to indicate the effectiveness of a new superintendent – by how many old time administrators decide to retire within the first two years he/she is hired. Not scientific, but a strong indication of the work environment.) So, although the new hires get the “least effective” schools, the staff is configured with veteran, mid term, and new teachers – the perfect combination. Also, those new teachers who remain in a challenging environment, quickly learn the ropes. It truly is survival of the fittest and not every newly minted teacher makes it to the end of the year (some quit the first week). After a few years, if they stay at that school, they are no longer “new” teachers.
One final story: In Buffalo, a principal can request a teacher’s transfer. If this happens the teacher gets top pick for placement (kind of a temporary super seniority). One year a teacher who was not getting good results was asked to transfer and she ended up at a much better school. Over night this “horrible” teacher became “phenomenal” and all her students passed the state wide final exam. Surprise! I have seen this scenario repeated over and over again.
So, my experiences back up your statistics or your statistics reflect what I have witnessed. Thus, eliminating tenure will do nothing to change test scores, just as taking an “excellent” teacher and putting them in a low performing school will not translate to higher test scores. If it were that easy, we would not be having this conversation. The problem would have been solved a long time ago.
Ellen’s observations mirror my own. We had a stable population of teachers in my (former) Title I school, with a 97% Free and reduced lunch rate. Out of 36 certified teachers, four earned the Danielson highly effective rating, thirty earned the effective rating and two were developing. It’s a myth that ineffective teachers work at schools with low income children, and it’s a myth that you can’t get rid of them. Effective administrators do it all the time.
Thank you patricia hale. It’s one thing to be on the outside trying to figure out the whys and wherefores. It’s another to be on the inside knowing the ins and outs.
And since numbers talk, it’s great to discover that the true statistics (not the bogus invented ones) are on our side.
Great stuff. Is there data on how many teachers in NYC are tenured? If so, could run a logistic regression for likelihood of being a tenured teacher based on increases in % Free Lunch, Sp Ed, ELL, Black, and Hispanic. Could also run a logistic regression to check for likelihood of being both tenured and rated ineffective. My educated guess: schools with higher percentages of free lunch students are far less likely to have tenured teachers than schools with lower percentages. This would completely undercut the reformy, nonsensical argument
If those filing this lawsuit should find the right wing judge of their choosing and prevail they should expect that members of the legislature would willfully ignore an agreed upon settlement (based upon how the legislature has failed to live up to their agreed upon settlement in NY State’s genuine Sound Basic Education case–CFE).
…and yet, the edreformers love love love the TFAers with 5 weeks of training and no certifications and no traditional clinical teaching or observing.
My daughter interviewed at a TFA affiliated charter in Newark. She was appalled by what she was forced to observe (a TFA teacher in training during summer school) and the way she was treated by the staff. The principal appeared to be 26 years old; clearly a TFA alum, as was the contact she dealt with through the entire process.
She said it was insulting to be told to observe and “that is the way to teach” while watching a brand new graduate who had no teacher training at all prior, while she was certified and had done a year of clinical teaching, and a year of substitute teaching. She was the highly qualified one, while the TFAer got all the kudos. She was very disillusioned but thought “a job is a job” until she got there. She said she would never have been able to treat the kids with the SLANT routine, keep them silent at all times, and punish them. This was a school that was k-3, and all of the “scholars” treated like mini-prisoners.
But, that is the game right now. The qualified/certified teachers are crap; but the TFA temps are aces. Yet, the reformers whine about the inexperienced non-highly qualified teachers, yet they go gaga for the TFAers. Can’t have it both ways. Can’t praise TFA and vilify the teachers who actually WANT to be teachers and went to school to learn correct pedagogy.
Shame on those whose job it is to destroy public education for personal gain.
More than 70 percent of the students in the schools where I taught for thirty years (1975-2005) were on free or reduced lunch and breakfast. The student population was also more than 70 percent Latino. Today those numbers are 80 percent. The local community around the schools was a gang infested barrio. In fact, I witnessed with my own eyes a drive by shooting as school let out. And shootings I didn’t witness were talked about in teacher lounges. Then there were the weekend shootings that would make the rounds of gossip in the teacher lounges on Mondays.
The difference between a competent teacher and one who isn’t competent—I refuse to use the word incompetent because that insinuates the teacher didn’t know the subject area they taught or how to teach it—was the ability to control the classroom environment so teaching and learning could thrive.
The ability to manage and control the learning environment in a classroom trumps teaching skills. In a classroom where order is maintained, even a boring teacher who doesn’t have a complete grasp of the subject being taught will still be able to teach and students learn.
Teachers, for any reason, who lacked the ability to maintain control among disruptive students were crippled when it came to teaching and students willing to learn were crippled because it was difficult to focus.
I can attest to the fact that even teachers who had mastered the methods to control a classroom often over populated with dysfunctional and disruptive students—thanks to gang bangers and/or kids who lived in poverty—seldom if ever had an ideal learning environment because these difficult students who refused to cooperate offered challenges almost daily no matter how many times their parents were called, there were parent conferences, administration was involved, the students were suspended to an in house suspension room or sent home for a few days, because there seemed to always be kids who were hell bent to disrupt and destroy learning.
New teacher often lacked the ability to control the classroom’s educational environment so teaching and learning could take place. Those would couldn’t learn or couldn’t take the stress are the ones that are gone in a few years. Many of these teachers leave with a bitter taste in their minds and resent the system that tortured them becasue they were not prepared for the challenges that walk in the classroom door daily.
Those teachers who survived and learned to control the learning environment would be the teachers who would often be there twenty, thirty and even forty years later.
Compared to the brightest TFA recruits from ivy league colleges, the colleges these survives graduated from and their GPAs might not measure up. The TFA recruit, on paper, would look smarter and superior, but in the classroom faced with the challenges that walk in the room, the TFA recruit often wilts while the veteran survive faces those challenges daily and thrives.
Bob, one of the high school history teachers, gathered the annual standardized test scores and compared the grizzled veterans with 10 or more years—in ten year increments up to thirty—to teachers with five years or less and discovered that the student test average was higher for the teachers with more classroom experience and over the years as the vets retired and newbies started to make up the majority of the staff, the overall schools average started to drop. In fact, the overall average doubled because of teachers with 20 years or more in the classroom.
Recently, I visited the HS’s website and looked at its school report card to discover that the average for the school had dropped by 50%. The only explanation is that most of the twenty years vets are gone now. They have retired and the staff is younger and less experienced at classroom control.
Lloyd – you have a strong argument. Anyone teaching today, especially in the inner city, can attest to the fact that student behavior is a huge issue. In the Buffalo Public Schools, attendance is spotty at best, including those in kindergarten. Yet, even if they do “show up” in class, they don’t necessary engage in learning. Often they are so disruptive that nobody can learn. Perhaps it is a defense mechanism – they don’t know what is going on, they don’t want to learn the material, and they get enjoyment from keeping others from learning (a sort of “misery loves company”). Even veteran teachers, with strong discipline skills, are fighting a losing battle.
My husband says that he now has the children of the difficult students he taught during his beginning teaching years. Back then, they didn’t care if they learned, and their children are even less engaged.
Ultimately, I wonder how statistically this can be measured. I’m sure you can analyze the correlation between attendance and test scores, but how do you measure behavior? How do you measure attitude?
At the high school where a taught (I retired in 2005 at sixty), we had an in-house suspension room called BIC. The teacher/administrator in charge, who was also a coach for one of the HS sports teams, told me once that there were 20,000 referrals written by the 100 teacher staff annually and 95% of those referrals were earned by 5% of the kids. At the time, the high school had about 2,500 students and five percent is 125.
But passive-aggressive kids, who also do not cooperate, did not disrupt the learning environment and do not earn many if any referrals. The passive-aggressive kids could be identified by the failure rate, which often ran as high as 50% during each semester and after a time-eating effort on my part making phone calls to parents, that number ended up as low as 30% by the end of a semester.
In fact, I do have numbers for one year, and that data represents pretty much my experience through the years.
I kept a very detailed daily journal for the 1994-95 school year and recently used that journal as my primary source for a memoir that came out last month. The struggle to teach these kids and their academic progress (names changed of course) runs through the memoir.
I love the title Lloyd, but you do realize that your diary is almost twenty years old. A lot has changed even over the last ten or so years since your retirement, especially in those states that adopted common core. Just take what you experienced and multiply it – or consider that the current crop of kids are the children of the ones you taught back in the 90’s.
You’re right, but there is a HUGE difference between a flawed abstract concept and a concrete fact of life.
Twenty years has gone by since I wrote that daily journal, but I think that the concrete challenges of teaching at risk kids hasn’t changed at all.
Poverty causes the same challenges, and there are more kids living in poverty today. Therefore, there will be more schools similar to the ones I taught where the poverty rate was 70 percent or higher. According to the FBI, there are also more gangs and more gang bangers on the streets now.
The only thing that’s changed is the addition of NCLB and then Obama’s Machiavellian Common Core agenda designed to destroy the public schools and force teachers to teach to a test that was designed to fail students and schools. These programs are based on unproven, abstract theories.
But poverty is based on concrete reality and my story shows the age old challenge of teachers struggling to work with too many at-risk kids that are not interested in learning—the same challenges back then are the same challenges today.
Take away the flawed abstract Common Core agenda, and the challenge to teach kids who live in poverty remains. Common Core will not fix poverty.
Common core is top down—that can easily be fixed by getting rid of the program or taking away the high stakes testing element of it. Kids living in poverty is bottom up and that concrete challenge isn’t as easy to solve.
Once a dedicated teacher closes that classroom door, regardless of the foolishness of Obama’s Common Core agenda, what’s left is a teacher and a classroom full of kids. The challenge to get those kids who live in poverty to cooperate and learn will be around a lot longer than Obama or his agenda. As long as there has been civilization, there has been poverty. The U.S. just has more of it than the other developed countries.
My memoir is not old enough to be history yet, and that story is relevant to what teachers face every day when they have classrooms filled with too many at-risk children who live in poverty.
Lloyd, I’m sure it is a fascinating book and that it is filled with truisms which transcend time.
In time, someone will write a teacher memoir about the NCLB, Race to the Top, Carter School, Common Core Education Wars. Maybe a teacher from Chicago who belongs to AFT will write it.
Reblogged this on aureliomontemayor and commented:
Attacking teachers doesn’t improve education.
I want to add one more thought. I retired in 2005, a decade after I wrote that daily journal, and the poverty rate of 70% remained the same but the number of kids cooperating went from about half to five percent. By cooperating, I mean the kids who read the assignments and did most or all of the class work and homework.
In fact, recently I checked Nogales High School’s most recent school report card—available on the internet—and the poverty rate is now up to 80 percent, a ten percent gain. The Latino population also went from 70 percent to 80 percent as the black and white ratio shrunk dramatically to almost nothing.
All that Common Core has done is make the teachers job more difficult—probably close to impossible considering the 100% college/career ready mandate for this year. When I left in 2005, the Academic Performance Index at Nogales was improving and approaching a 4 on the 10 scale for California. As that poverty rate soared, the API has dropped like a bomb in the decade since I left.
In addition, I still have colleagues and friends who are still teaching and I’m well aware that their job is more challenging than when I was still teaching.
I know there are stats which will point to a similar trend in Buffalo.