The Endogeneity of the Equitable Distribution of Teachers: Or, why do the girls get all the good teachers?

Recently, the Center for American Progress (disclosure: I have a report coming out through them soon) released a report in which they boldly concluded, based on data on teacher ratings from Massachusetts and Louisiana, that teacher quality is woefully inequitably distributed across children by the income status of those children. As evidence of these inequities, the report’s authors included a few simple graphs, like this one, showing the distribution of teachers by their performance categories:

Figure 1. CAP evidence of teacher quality inequity in Massachusetts

Slide1

Based on this graph, the authors conclude:

In Massachusetts, the percentage of teachers rated Unsatisfactory is small overall, but students in high-poverty schools are three times more likely to be taught by one of them. The distribution of Exemplary teachers favors students in high-poverty schools, who are about 30 percent more likely to be taught by an exemplary teacher than are students in low-poverty schools. However, students in high-poverty schools are less likely to be taught by a Proficient teacher and more likely to be taught by a teacher who has received a Needs Improvement rating. (p. 4)

But, there exists (at least) one huge problem of making the assertion that teacher ratings, built significantly on measures such as Student Growth Percentiles, provide evidence of inequitable distribution of teaching quality. It is very well understood that many value added estimates in state policy and practice, and most if not all student growth percentile measures used in state policy and practice are substantially influenced by student population characteristics including income status, prior performance and even gender balance of classrooms.

Let me make this absolutely clear one more time – simply because student growth percentile measures are built on expected current scores of individual students based on prior scores does not mean, by any stretch of the statistical imagination, that SGPs “fully account for student background” and even more so, for the classroom context factors including other students and the student group in the aggregate. Further, Value Added Models (VAMs) which may take additional steps to account for these potential sources of bias are typically not successful at removing all such bias.

Figure 2 here shows the problem. As I’ve explained numerous previous times, growth percentile and value added measures contain 3 basic types of variation:

  1. Variation that might actually be linked to practices of the teacher in the classroom;
  2. Variation that is caused by other factors not fully accounted for among the students, classroom setting, school and beyond;
  3. Variation that is, well, complete freakin statistical noise (in many cases, generated by the persistent rescaling and stretching, cutting and compressing, then stretching again, changes in test scores over time which may be built on underlying shifts in 1 to 3 additional items answered right or wrong by 9 year olds filling in bubbles with #2 pencils).

Our interest in #1 above, but to the extent that there is predictable variation, which combines #1 and #2, we are generally unable to determine what share of the variation is #1 and what share is #2.

Figure 2. The Endogeneity of Teacher Quality Sorting and Ratings Bias

Slide2

A really important point here is that many if not most models I’ve seen actually adopted by states for evaluating teachers do a particularly poor job at parsing 1 & 2. This is partly due to the prevalence of growth percentile measures in state policy.

This issue becomes particularly thorny when we try to make assertions about the equitable distribution of teaching quality. Yes, as per the figure above, teachers do sort across schools and we have much reason to believe that they sort inequitably. We have reason to believe they sort inequitably with respect to student population characteristics. The problem is that those same student population characteristics in many cases also strongly influence teacher ratings.

As such, those teacher ratings themselves aren’t very useful for evaluating the equitable distribution of teaching. In fact, in most cases it’s a pretty darn useless exercise, ESPECIALLY with the measures commonly adopted across states to characterize teacher quality.Being able to determine the inequity of teacher quality sorting requires that we can separate #1 and #2 above. That we know the extent to which the uneven distribution of students affected the teacher rating versus the extent to which teachers with higher ratings sorted into more advantaged school settings.

Now, let’s take a stroll through just how difficult it is to sort out whether the inequity CAP sees in Massachusetts teacher ratings is real, or more likely just a bad, biased ratings system.

Figure 3 relates the % of teachers in the bottom two ratings categories to the share of children qualified for free lunch, by grade level, across Massachusetts schools. As we can see, low poverty schools tend to have very few of those least effective teachers, whereas many, though not all higher poverty schools do have larger shares, consistent with the CAP findings.

Figure 3. Relating Shares of Low Rated Teachers and School Low Income Share in Massachusetts

Slide3

Figure 4 presents the cross school correlations between student demographic indicators and teacher ratings. Again, we see that there are more low rated teachers in higher poverty, higher minority concentration schools.

But, as a little smell-test here, I’ve also included % female students, which is often a predictor of not just student test score levels but also rates of gain. What we see here is that at the middle and secondary level, there are fewer “bad” teachers in schools that have higher proportions of female students.

Does that make sense? Is it really the case that the “good” teachers are taking the jobs in the schools with more girls?

Figure 4. Relating Shares of Low Rated Teachers and School Demographics in Massachusetts

 Slide4


Okay, let’s do this as a multiple regression model, and for visual clarity, graph the coefficients in Figure 5. Here, I’ve regressed the % low performing teachers on each of the demographic measures. In find a negative (though only sig. at p<.10) effect on the % female measure. That is, schools with more girls have fewer “bad” teachers. Yes, schools with more low income kids seem to have more “bad” teachers, but in my view, the whole darn thing is suspect.

Figure 5. Regression Based Estimates of Teacher Rating Variation by Demography in Massachusetts

Slide5

So, the Massachusetts ratings seem hardly useful for sorting out bias versus actual quality and thus determining which kids are being subjected to better or worse teachers.

But what about other states? Well, I’ve written much about the ridiculous levels of bias in the New Jersey Growth Percentile measures. But, here they are again.

Figure 6. New Jersey School Growth Percentiles by Low Income Concentration and Grade 3 Mean Scale Scores

 Slide6

Figure 6 shows that New Jersey school median growth percentiles are associated with both low income concentration and average scale scores of the first tested grade level. The official mantra of the state department of education is that these patterns obviously reflect that low income, low performing children are simply getting the bad teachers. But that, like the CAP finding above, is an absurd stretch given the complete lack of evidence as to what share of these measures, if any, can actually be associated with teacher effect and what share is driven by context and students.

So, let’s throw in that percent female effect just for fun. Table 1 provides estimates from a few alternative regression models of the school level SGP data. As with the Massachusetts ratings, the regressions show that the share of student population that is female is positively associated with school level median growth percentile, and quite consistently and strongly so.

Now, extending CAP’s logic to these findings, we must now assume that the girls get the best teachers! Or at least that schools with more girls are getting the better teachers. It could not possibly have anything to do with classrooms and schools having more girls being, for whatever reason, more likely to generate test score gains, even with the same teachers? But then again, this is all circular.

Table 1. Regressions of New Jersey School Level Growth Percentiles on Student Characteristics

Slide7

Note here that these models are explaining in the case of LAL, nearly 40% of the variation in growth percentiles. That’s one heck of a lot of potential bias. Well, either that, or teacher sorting in NJ is particularly inequitable. But knowing what’s what here is impossible. My bet is on some pretty severe bias.

Now for one final shot, with a slightly different twist. New York City uses a much richer value-added model which accounts much more fully for student characteristics. The model also accounts for some classroom and school characteristics. But the New York City model, which also produces much noisier estimates as a result (the more you parse the bias, the more you’re left with noise), doesn’t seem to fully capture some other potential contributors to value added gains. The regressions in Table 2 below summarize resource measures that predict variation in school aggregated teacher value added estimates for NYC middle schools.

Table 2. How resource variation across MIDDLE schools influences aggregate teacher value-added in NYC

Slide8

Schools with smaller classes or higher per pupil budgets have higher average teacher value added! It’s also the case that schools with higher average scale scores have higher average teacher value added. That poses a potential bias problem. Student characteristics must be evaluated in light of the inclusion of the average scale score measure.

Indeed, more rigorous analyses can be done to sort the extent that “better” (higher test score gain producing) teachers migrate to more advantaged schools, but with very limited samples of data on teachers having prior ratings in one setting who then sort to another (and maintain some stable component of their prior rating). Evaluating in large scale, without tracking individual moves, even when trying to include a richer set of background variables is likely to mislead.

Another alternative is to reconcile teacher sorting by outcome measures with teacher sorting by other characteristics that are exogenous (not trapped in this cycle of cause and effect). Dan Goldhaber and colleagues provide one recent example applied to data on teachers in Washington State. Goldhaber and colleagues compared the distribution of a) novice teachers, b) teachers with low VAM estimates and c) teachers by their own test scores on a certification exam, across classrooms, schools and districts by 1) minority concentration, 2) low income concentration and 3) prior performance. That is, the reconciled the distribution of their potentially endogenous measure (VAM) with two exogenous measures (teacher attributes). And they did find disparities.

Notably, in contrast with much of the bluster about teacher quality distribution being primarily a function of corrupt, rigid contract driving within district and within school assignment of teachers, Goldhaber and colleagues found the between district distribution of teacher measures to be most consistently disparate:

For example, the teacher quality gap for FRL students appears to be driven equally by teacher sorting across districts and teacher sorting across schools within a district. On the other hand, the teacher quality gap for URM (underrepresented minority) students appears to be driven primarily by teacher sorting across districts; i.e., URM students are much more likely to attend a district with a high percentage of novice teachers than non-URM students. In none of the three cases do we see evidence that student sorting across classrooms within schools contributes significantly to the teacher quality gap.

These findings, of course, raise issues regarding the logic that district contractual policies are the primary driver of teacher quality inequity (the BIG equity problem, that is). Separately, while the FRL results are not entirely consistent with the URM (Underrepresented Minority) findings, this may be due to the use of a constant income threshold for comparing districts in rural Eastern Washington to districts in the Seattle metro. Perhaps more on this at a later point.

Policy implications of misinformed conclusions from bad measures

The implications of ratings bias vary substantially by the policy preferences supported to resolve the supposed inequitable distribution of teaching. One policy preference is the “fire the bad teachers” preference, assuming that a whole bunch of better teachers will line up to take their jobs. If we impose this policy alternative using such severely biased measures as the Massachusetts or New Jersey measures, we will likely find ourselves disproportionately firing and detenuring, year after year, teachers in the same high need schools, having little or nothing to do with the quality of the teachers themselves. As each new batch of teachers enters these schools, and subsequently faces the same fate due to the bogus, biased measures it seems highly unlikely that high quality candidates will continue to line up. This is a disaster in the making. Further, applying the “fire the bad teachers” approach in the presence of such systematically biased measures is likely a very costly option – both in terms of the district costs of recruiting and training new batches of teachers year after year, and the costs of litigation associated with dismissing their predecessors based on junk measures of their effectiveness.

Alternatively, if one provides compensation incentives to draw teachers into “lower performing” schools, and perhaps take efforts to improve working conditions (facilities, class size, total instructional load), fewer negative consequences – even in the presence of bad, biased measurement, are likely to occur. One can hope, based on recent studies of transfer incentive policies, that some truly “better” teachers would be more likely to opt to work in schools serving high need populations, even where their own rating might be at greater risk (assuming policy does not assign high stakes to that rating). This latter approach certainly seems more reasonable, more likely to do good, and at the very least far less likely to do serious harm.

An Update on New Jersey’s SGPs: Year 2 – Still not valid!

I have spent much time criticizing New Jersey’s Student Growth Percentile measures over the past few years, both conceptually and statistically. So why stop now.

We have been told over and over again by the Commissioner and his minions that New Jersey’s SGPs take fully into account student backgrounds by accounting for each student’s initial score and comparing students against others with similar starting point.  I have explained over and over again that just because individual student’s growth percentiles are estimated relative to others with similar starting points by no means validates that classroom median growth percentiles or school median growth percentiles are by any stretch of the imagination a non-biased measure of teacher or school quality.

The assumption is conceptually wrong and it is statistically false! New Jersey’s growth percentile measures are NOT a valid indicator of school or teacher quality [or even school or teacher effect on student test score change from time 1 to time 2], plain and simple. Adding a second year of data to the mix reinforces my previous conclusions.

Now that we have a second year of publicly available school aggregate growth percentile measures, we can ask a few very simple questions. Specifically, we can ask how stable, or how well correlated those school level SGPs are from one year to the next, across all the same schools?

I’ve explained previously, however, that stability of these measures over time may actually reflect more bad than good. It may simply be that the SGPs stay relatively stable from one year of the next because they are picking up factors such as the persistent influence of child poverty, effects of being clustered with higher or lower performing classmates/schoolmates, or that the underlying test scales simply allow for either higher or lower performing students to achieve greater gains.

That is, SPGs might be stable merely because of stable bias! If that is indeed the case, it would be particularly foolish to base significant policy determinations on these measures.

Let’s clarify this using the research terms “reliability” and “validity.”

  • Validity means that a measure measures what is intended to, which in this case, is that the measure is intended to capture the influence of schools and teachers on changes in student test scores  over time. That is, the measure is not simply capturing something else. Validity is presumed good, but only to the extent those choosing what to measure are making good choices.  One might, for example, choose to, and fully accomplish measurement of something totally useless (one can debate the value of measuring differences over time in reading and math scores as representative more broadly of teacher or school quality).
  • Reliability means that a measure is consistent over time, presumed to mean that it is consistently capturing something over time. Too many casual readers of research and users of these terms assume reliability is inherently good. That a reliable measure is always a good measure. That is not the case if the measure is reliable simply because it is consistently measuring the wrong thing. A measure can quite easily be reliably invalid.

So, let’s ask ourselves a few really simple empirical questions using last year’s and this year’s SGP data, and a few other easily accessible measures like average proficiency rates and school rates of children qualified for free lunch (low income).

  • How stable are NJ’s school level SGPs from year 1 to year 2?
  • If they are stable, or reasonably correlated, might it be because they are correlated to other stuff?
    • Average prior performance levels?
    • School level student population characteristics?

If we were seeking a non-biased and stable measure of school or teacher effectiveness, we would expect to find a high correlation from one year to the next on the SGPs, coupled with low correlations between those SGPs and other measures like prior average performance or low income concentrations.

By contrast, if we find relatively high year over year correlation for our SGPS but also find that the SGPS on average over the years are correlated with other stuff (average performance levels and low income concentrations), then it becomes far more likely that the stability we are seeing is “bad” stability (false signal or bias) rather than “good” stability (true signal of teacher or school quality).

That is, we are consistently mis-classifying schools (and by extension their teachers) as good or bad, simply because of the children they serve!

Well then, here’s the correlation matrix (scatterplots below):

Slide1

The bottom line is that New Jersey’s language arts SGPs are:

  • Nearly as strongly (when averaged over two years) correlated with concentrations of low income children as they are with themselves over time!
  • As strongly (when averaged over two years) correlated with prior average performance than they are with themselves over time!

Patterns are similar for math.  Year over year correlations for math (.61) are somewhat stronger than correlations between math SGPs and performance levels (.45 to .53) or low income concentration (-.38). But, correlations with performance levels and low income concentrations remain unacceptably high – signalling substantial bias.

The alternative explanation is to buy into the party line that what we are really seeing here is the distribution of teaching talent across New Jersey schools. Lower poverty schools simply have the better teachers. And thus, those teachers must have been produced by the better colleges/universities.

Therefore, we should build all future policies around these ever-so-logical, unquestionably valid findings. That the teachers in high poverty schools whose children had initially lower performance and thus systematically lower SGPs, must be fired and a new batch brought in to replace them. Heck, if the new batch of teachers is even average (like teachers in schools of average poverty and average prior scores), then they can lift those SGPs and average scores of high poverty below average schools toward the average.

At the same time, we must track down the colleges of education responsible for producing those teachers in high poverty schools who failed their students so miserably and we must impose strict sanctions on those colleges.

That’ll work, right? No perverse incentives here? Especially since we are so confident in the validity of these measures?

Nothing can go wrong with this plan, right?

A vote of no confidence is long overdue here!

Slide2

Slide3

Slide4Slide5Slide6Slide7Slide8Slide9

The Value Added & Growth Score Train Wreck is Here

In case you hadn’t noticed evidence is mounting of a massive value-added and growth score train wreck. I’ve pointed out previously on this blog that there exist some pretty substantial differences in the models and estimates of teacher and school effectiveness being developed in practice across states for actual use in rating, ranking, tenuring and firing teachers – and rating teacher prep programs – versus the models and data that have been used in high profile research studies. This is not to suggest that the models and data used in high profile research studies are ready for prime time in high stakes personnel decisions.  They are not. They reveal numerous problems of their own. But many if not most well-estimated, carefully vetted value-added models used in research studies a) test alternative specifications including use of additional covariates at the classroom and school level, or include various “fixed effects” to better wash away potential bias and b) through this process, end up using substantially reduced samples of teachers for whom data on substantial samples of students across multiple sections/classes within year and across years are available (see, for example: http://nepc.colorado.edu/files/NEPC-RB-LAT-VAM_0.pdf ). Constraints imposed in research to achieve higher quality analyses often result in loss of large numbers of cases, and result potentially in clearer findings, which makes similar approaches infeasible where the goal is not to produce the most valid research but instead to evaluate the largest possible number of teachers or principals (where seemingly, validity should be an even greater concern).

Notably, even where these far cleaner data and  far richer models are applied, critical evaluators of the research on the usefulness of these value-added models suggest that… well… there’s just not much there.

Haertel:

My first conclusion should come as no surprise: Teacher VAM scores should emphatically not be includ­ed as a substantial factor with a fixed weight in conse­quential teacher personnel decisions. The information they provide is simply not good enough to use in that way. It is not just that the information is noisy. Much more serious is the fact that the scores may be system­atically biased for some teachers and against others… (p. 23)

https://www.ets.org/Media/Research/pdf/PICANG14.pdf

Rothstein on Gates MET:

Hence, while the report’s conclusion that teachers who perform well on one measure “tend to” do well on the other is technically correct, the tendency is shockingly weak. As discussed below (and in contrast to many media summaries of the MET study), this important result casts substantial doubt on the utility of student test score gains as a measure of teacher effectiveness.

http://nepc.colorado.edu/files/TTR-MET-Rothstein.pdf

A really, really, important point to realize is that the models that are actually being developed, estimated and potentially used by states and local public school districts for such purposes as determining which teachers get tenure, or determining teacher bonuses or salaries, who gets fired… or even which teacher preparation institutions get to keep their accreditation?…. those models increasingly appear to be complete junk!  

Let’s review what we now know about a handful of them:

New York City

I looked at New York City value-added findings when the teacher data were released a few years back.  I would argue that the New York City model is probably better than most I’ve seen thus far and its technical documentation reveals more thorough attempts to resolve common concerns about bias. Yet, the model, by my cursory analysis still fails to produce sufficiently high quality information for confidently judging teacher effectiveness.

Among other things, I found that only in the most recent year, were the year over year correlations even modest, and the numbers of teachers in the top 20% for multiple years running astoundingly low. Here’s a quick summary of a few previous posts:

Math – Likelihood of being labeled “good”

  • 15% less likely to be good in school with higher attendance rate
  • 7.3% less likely to be good for each 1 student increase in school average class size
  • 6.5% more likely to be good for each additional 1% proficient in Math

Math – Likelihood of being repeatedly labeled “good”

  • 19% less likely to be sequentially good in school with higher attendance rate (gr 4 to 8)
  • 6% less likely to be sequentially good in school with 1 additional student per class (gr 4 to 8)
  • 7.9% more likely to be sequentially good in school with 1% higher math proficiency rate.

Math [flipping the outcome measure] – Likelihood of being labeled “bad”

  • 14% more likely to be bad in school with higher attendance rate.
  • 7.9% more likely to be sequentially bad for each additional student in average class size (gr 4 to 8)

https://schoolfinance101.wordpress.com/2012/02/28/youve-been-vam-ified-thoughts-graphs-on-the-nyc-teacher-data/

New York State

Then there are the New York State conditional Growth Percentile Scores.  First, here’s what the state’s own technical report found:

 Despite the model conditioning on prior year test scores, schools and teachers with students who had higher prior year test scores, on average, had higher MGPs. Teachers of classes with higher percentages of economically disadvantaged students had lower MGPs. (p. 1) http://schoolfinance101.files.wordpress.com/2012/11/growth-model-11-12-air-technical-report.pdf

And in an astounding ethical lapse, only a few paragraphs later, the authors concluded:

The model selected to estimate growth scores for New York State provides a fair and accurate method for estimating individual teacher and principal effectiveness based on specific regulatory requirements for a “growth model” in the 2011-2012 school year. p. 40 http://engageny.org/wp-content/uploads/2012/06/growth-model-11-12-air-technical-report.pdf

Concerned about what they were seeing, Lower Hudson Valley superintendents commissioned an outside analysis of data on their teachers and schools provided by the state.  Here is a recent Lower Hudson Valley news summary of the findings of that report:

But the study found that New York did not adequately weigh factors like poverty when measuring students’ progress.

“We find it more common for teachers of higher-achieving students to be classified as ‘Effective’ than other teachers,” the study said. “Similarly, teachers with a greater number of students in poverty tend to be classified as ‘Ineffective’ or ‘Developing’ more frequently than other teachers.”

Andrew Rice, a researcher who worked on the study, said New York was dealing with common challenges that arise when trying to measure teacher impact amid political pressures.

“We have seen other states do lower-quality work,” he said.

http://www.lohud.com/article/20131015/NEWS/310150042/Study-faults-NY-s-teacher-evaluations

That’s one heck of an endorsement, eh? We’ve seen others do worse?

Perhaps most offensive is that New York State a) requires that if the teacher receives a bad growth measure rating, the teacher cannot be given a good overall rating and b) the New York State Commissioner has warned local school officials that the state will intervene “if there are unacceptably low correlation results between the student growth sub-component and any other measure of teacher and principal effectiveness.”  In other words, districts must ensure that all other measures are sufficiently correlated with the state’s own junk measure.

Ohio (school level)

In brief, in my post on Ohio Value Added scores, at the school level, I found that year over year correlations were nearly 0 – the year to year ratings of schools were barely correlated with themselves and on top of that, were actually correlated with things with which they should not be correlated.  https://schoolfinance101.wordpress.com/2011/11/06/when-vams-fail-evaluating-ohios-school-performance-measures/

New Jersey (school level)

And then there’s New Jersey, which, while taking a somewhat more measured approach to adoption and use of their measures than in New York, has adopted measures which appear to be among the most problematic I’ve seen.

Here are a few figures:

Slide9Slide10Slide11Slide12Slide13And here is a link to a comprehensive analysis of these measures and the political rhetoric around them. http://njedpolicy.files.wordpress.com/2013/05/sgp_disinformation_bakeroluwole1.pdf

Conclusions & Implications?

At this point, I’m increasingly of the opinion that even if there was a possible reasonable use of value-added and growth data for better understanding variations in schooling and classroom effects on measured learning, I no longer have any confidence that these reasonable uses can occur in the  current policy environment.

What are some of those reasonable uses and strategies?

First, understanding the fallibility of any one model of school or teacher effects is critically important, and we should NEVER, NEVER, NEVER be relying on a single set of estimates from one model specification to make determinations about teacher, or school… or teacher preparation program effectiveness. Numerous analysis using better data and richer models than those adopted by states have shown that teacher, school or other rankings and ratings vary sometimes wildly under different model specifications. It is by estimating multiple different models and seeing how the rank orders and estimates change that we can get some better feel for what’s going on (knowing what we’ve changed in our models), and whether or the extent to which our models are telling us anything useful. The political requirement of adopting a single model forces bad decision making and bad statistical interpretation.

Second, at best the data revealed by multiple alternative models might be used as exploratory tools in large systems to see where things appear to be working better or worse, with respect to producing incremental changes in test scores, where test scores exist and are perceived meaningful. That’s a pretty limited scope to begin with. But informed statistical analysis may provide guidance on where to look more closely – which classrooms or schools to observe more frequently. But, these data will never provide us definitive information that can or should be used as a determinative factor in high stakes personnel decisions.

But that’s precisely the opposite of current policy prescriptions.

Unlike a few years back, when I was speculating that such problems might lead to a flood of litigation regarding the fairness of using these measures for rating, ranking and dismissing teachers, we now have substantial information that these problems are real.

Even more so from a litigation perspective, we have substantial information that policy makers have been made aware of these problems – especially problems of bias in rating systems – and that some policymakers, most notably New York’s John King have responded with complete disregard.

Can we just make it all stop! ???

Rebutting (again) the Persistent Flow of Disinformation on VAM, SGP and Teacher Evaluation

This post is in response to testimony overheard from recent presentations to the New Jersey State Board of Education. For background and more thorough explanations of issues pertaining to the use of Value-added Models and Student Growth Percentiles please see the following two sources:

  • Baker, B.D., Oluwole, J., Green, P.C. III (2013) The legal consequences of mandating high stakes decisions based on low quality information: Teacher evaluation in the race-to-the-top era. Education Policy Analysis Archives, 21(5). This article is part of EPAA/AAPE’s Special Issue on Value-Added: What America’s Policymakers Need to Know and Understand, Guest Edited by Dr. Audrey Amrein-Beardsley and Assistant Editors Dr. Clarin Collins, Dr. Sarah Polasky, and Ed Sloat. Retrieved [date], from http://epaa.asu.edu/ojs/article/view/1298
  • Baker, B.D., Oluwole, J. (2013) Deconstructing Disinformation on Student Growth Percentiles & Teacher Evaluation in New Jersey. New Jersey Education Policy Forum 1(1) http://njedpolicy.files.wordpress.com/2013/05/sgp_disinformation_bakeroluwole1.pdf

Here, I address a handful of key points.

First, different choices of statistical model or method for estimating teacher “effect” on test score growth matter. Indeed, one might find that adding new variables, controlling for this, that and the other thing, doesn’t always shift the entire pattern significantly, but a substantial body of literature indicates that even subtle changes to included variables or modeling approach can significantly change individual teacher’s ratings and significantly reshuffle teachers across rating categories. Further, these changes may be most substantial for those teachers in the tails of the distribution – or those for whom the rating might be most consequential.

Second, I reiterate that Value-added models in their best, most thorough form, are not the same as student growth percentile estimates. Specifically, those who have made direct comparisons of VAMs versus SGPs for rating teachers have found that SGPs – by omission of additional variables – are less appropriate. That is, they don’t to a very good job of sorting out the teacher’s influence on test score growth!

Third, I point out that the argument that VAM as a teacher effect indicator is as good as batting average for hitters or earned run average for pitchers simply means that VAM is a pretty crappy indicator of teacher quality.

Fourth, I reiterate a point I’ve made on numerous occasions, that just because we see a murky pattern of relationship and significant variation across thousands of points in scatterplot doesn’t mean that we can make any reasonable judgment about the position of any one point in that mess. Using VAM or SGP to make high stakes personnel decisions about individual teachers violates this very simple rule. Sticking specific, certain, cut scores through these uncertain estimates in order to categorize teachers as effective or not violates this very simple understanding rule.

Two Examples of How Models & Variables Matter

States are moving full steam ahead on adopting variants of value added and growth percentile models for rating their teachers and one thing that’s becoming rather obvious is that these models and the data on which they rely vary widely. Some states and districts have chosen to adopt value added or growth percentile models that include only a single year of student prior scores to address differences in student backgrounds, and others are adopting more thorough value added models which also include additional student demographic characteristics, classroom characteristics including class size, and other classroom and school characteristics that might influence – outside the teacher’s control – the growth in student outcomes. Some researchers have argued that in the aggregate – across the patterns as a whole – this stuff doesn’t always seem to matter that much. But we also have a substantial body of evidence that when it comes to the individual rating teachers it does.

For example, a few years back, the Los Angeles times contracted Richard Buddin to estimate a relatively simple value-added model of teacher effect on test scores in Los Angeles. Buddin included prior scores and student demographic variables. However, in a critique of Buddin’s report, Briggs and Domingue ran the following re-analysis to determine the sensitivity of individual teacher ratings to model changes, including additional prior scores and additional demographic and classroom level variables:

The second stage of the sensitivity analysis was designed to illustrate the magnitude of this bias. To do this, we specified an alternate value-added model that, in addition to the variables Buddin used in his approach, controlled for (1) a longer history of a student’s test performance, (2) peer influence, and (3) school-level factors. We then compared the results—the inferences about teacher effectiveness—from this arguably stronger alternate model to those derived from the one specified by Buddin that was subsequently used by the L.A. Times to rate teachers. Since the Times model had five different levels of teacher effectiveness, we also placed teachers into these levels on the basis of effect estimates from the alternate model. If the Times model were perfectly accurate, there would be no difference in results between the two models. Our sensitivity analysis indicates that the effects estimated for LAUSD teachers can be quite sensitive to choices concerning the underlying statistical model. For reading outcomes, our findings included the following:

Only 46.4% of teachers would retain the same effectiveness rating under both models, 8.1% of those teachers identified as effective under our alternative model are identified as “more” or “most” effective in the L.A. Times specification, and 12.6% of those identified as “less” or “least” effective under the alternative model are identified as relatively effective by the L.A. Times model.

For math outcomes, our findings included the following:

Only 60.8% of teachers would retain the same effectiveness rating, 1.4% of those teachers identified as effective under the alternative model are identified as ineffective in the L.A. Times model, and 2.7% would go from a rating of ineffective under the alternative model to effective under the L.A. Times model.

The impact of using a different model is considerably stronger for reading outcomes, which indicates that elementary school age students in Los Angeles are more distinctively sorted into classrooms with regard to reading (as opposed to math) skills. But depending on how the measures are being used, even the lesser level of different outcomes for math could be of concern.

  • Briggs, D. & Domingue, B. (2011). Due diligence and the evaluation of teachers: A review of the value-added analysis underlying the effectiveness rankings of Los Angeles Unified School District Teachers by the Los Angeles Times. Boulder, CO: National Education Policy Center. Retrieved June 4, 2012 from http://nepc.colorado.edu/publication/due-diligence.

Similarly, Ballou and colleagues ran sensitivity tests of teacher ratings applying variants of VAM models:

As the availability of longitudinal data systems has grown, so has interest in developing tools that use these systems to improve student learning. Value-added models (VAM) are one such tool. VAMs provide estimates of gains in student achievement that can be ascribed to specific teachers or schools. Most researchers examining VAMs are confident that information derived from these models can be used to draw attention to teachers or schools that may be underperforming and could benefit from additional assistance. They also, however, caution educators about the use of such models as the only consideration for high-stakes outcomes such as compensation, tenure, or employment decisions. In this paper, we consider the impact of omitted variables on teachers’ value-added estimates, and whether commonly used single-equation or two-stage estimates are preferable when possibly important covariates are not available for inclusion in the value-added model. The findings indicate that these modeling choices can significantly influence outcomes for individual teachers, particularly those in the tails of the performance distribution who are most likely to be targeted by high-stakes policies.

In short, the conclusions here are that model specification and variables included matter. And they can matter a lot. It is reckless and irresponsible to assert otherwise and even more so to never bother to run comparable sensitivity analyses to those above prior to requiring the use of measures for high stakes decisions.

SGP & a comprehensive VAM are NOT THE SAME!

This point is really just an extension of the previous. Most SGP models, which are a subset of VAM, take the simplest form of accounting only for a single prior year of test score. Proponents of SPGs like to make a big deal about how the approach re-scales the data from its original artificial test scaling to a scale-free (and thus somehow problem free?) percentile rank measure. The argument is that we can’t really ever know, for example, whether it’s easier or harder to increase your SAT (or any test) score from 600 to 650, or from 700 to 750, even though they are both 50 pt increases. Test-score distances simply aren’t like running distances. You know what? Neither are ranks/percentiles that are based on those test score scales! Rescaling is merely recasting the same ol’ stuff, though it can at times be helpful for interpreting results.  If the original scores don’t show legitimate variation – for example, if they have a  strong ceiling or floor effect, or simply have a lot of meaningless (noise) variation – then so too will any rescaled form of them.

Setting aside the re-scaling smokescreen, two recent working papers compare SGP and VAM estimates for teacher and school evaluation and both raise concerns about the face validity and statistical properties of SGPs.  And here’s what they find.

Goldhaber and Walch (2012) conclude “For the purpose of starting conversations about student achievement, SGPs might be a useful tool, but one might wish to use a different methodology for rewarding teacher performance or making high-stakes teacher selection decisions” (p. 30).

  •  Goldhaber, D., & Walch, J. (2012). Does the model matter? Exploring the relationship between different student achievement-based teacher assessments. University of Washington at Bothell, Center for Education Data & Research. CEDR Working Paper 2012-6.

Ehlert and colleagues (2012) note “Although SGPs are currently employed for this purpose by several states, we argue that they (a) cannot be used for causal inference (nor were they designed to be used as such) and (b) are the least successful of the three models [Student Growth Percentiles, One-Step & Two-Step VAM] in leveling the playing field across schools”(p. 23).

  •  Ehlert, M., Koedel, C., &Parsons, E., & Podgursky, M. (2012). Selecting growth measures for school and teacher evaluations. National Center for Analysis of Longitudinal Data in Education Research (CALDER). Working Paper #80. http://ideas.repec.org/p/umc/wpaper/1210.html

If VAM is as reliable as Batting Averages or ERA, that simply makes it a BAD INDICATOR of FUTURE PERFORMANCE!

I’m increasingly mind-blown by those who return, time after time, to really bad baseball analogies to make their point that these value-added or SGP estimates are really good indicators of teacher effectiveness.  I’m not that much of a baseball statistics geek, though I’m becoming more and more intrigued as time passes.  The standard pro-VAM argument goes that VAM estimates for individual teachers have a correlation of about .35 from one year to the next. Casual readers of statistics often see this as “low” working from a relatively naïve perspective that a high correlation is about .8.  The idea is that a good indicator of teacher effect would have to be an indicator which reveals the true, persistent effectiveness of that teacher from year to year. Even better, a good indicator would be one that allows us to tell if that teacher is likely to be a good teacher in future years. A correlation of only about .35 doesn’t give us much confidence.

That said, let’s be clear that all we’re even talking about here is the likelihood that a teacher having students who showed test score gains in one year, is likely to have a new batch of students who show similar test score gains the following year (or at least in relative terms, the teacher who is above the average of teachers for their student test score gains remains similarly above the average of teachers for their students’ test score gains the following year). That is, the measure itself may be of very limited use, thus the extent to which it is consistent or not may not really be that important. But I digress.

In order to try to make a .35 correlation sound good, VAM proponents will often argue that the year over year correlation between baseball batting averages, or earned run averages is really only about the same. And since we all know that batting average and earned run average are really, really important baseball indicators of player quality, then VAM must be a really, really important indicator of teacher quality. Uh… not so much!

If there’s one thing Baseball statistics geeks really seem to agree on, it’s that Batting Averages and Earned Run Averages for pitchers are crappy predictors of future performance precisely because of their low year over year correlation.

This piece from beyondtheboxscore.com provides some explanation:

Not surprisingly, Batting Average comes in at about the same consistency for hitters as ERA for pitchers. One reason why BA is so inconsistent is that it is highly correlated to Batting Average on Balls in Play (BABIP)–.79–and BABIP only has a year-to-year correlation of .35.

Descriptive statistics like OBP and SLG fare much better, both coming in at .62 and .63 respectively. When many argue that OBP is a better statistic than BA it is for a number of reasons, but one is that it’s more reliable in terms of identifying a hitter’s true skill since it correlates more year-to-year.

And this piece provides additional explanation of descriptive versus predictive metrics.

An additional really important point here, however, is that these baseball indicators are relatively simple, mathematical calculations – like taking the number of hits (relatively easily measured term) divided by at bats (also easily measured). These aren’t noisy regression estimates based on the test bubble-filling behaviors of groups of 8 and 9 year old kids.  And most baseball metrics are arguably more clearly related to the job responsibilities of the player – though the fun stuff enters in when we start talking about modeling personnel decisions in terms of their influence on wins above replacement.

Just because you have a loose/weak pattern across thousands of points doesn’t add to the credibility of judging any one point!

One of the biggest fallacies in the application of VAM (or SGP) is that having a weak or modest relationship between year over year estimates for the same teachers, produced across thousands of teachers serving thousands of students, provides us with good enough (certainly better than anything else!) information to inform school or district level personnel policy.

Wrong! Knowing that there exists a modest pattern in a scatterplot of thousands of teachers from year one to year two, PROVIDES US WITH LITTLE USEFUL INFORMATION ABOUT ANY ONE POINT IN THAT SCATTERPLOT!

In other words, given the degrees of noise in these best case (least biased) estimates, there exists very limited real signal about the influence of any one teacher on his/her student’s test scores.  What we have here is limited real signal on a measure – measured test score gains from last year to this – which captures a very limited scope of outcomes. And, if we’re lucky, we can generate this noisy estimate of a measure of limited value on about 1/5 of our teachers.

Asserting that useful information can be garnered about the position of a single point in a massive scatterplot, based on such a loose pattern violates the most basic understandings of statistics. And this is exactly what using Value Added estimates to evaluate individual teachers, and put them into categories based on specific cut scores applied these noisy measures does!

The idea that we can apply strict cut scores  to noisy statistical regression model estimates to characterize an individual teacher as “highly effective” versus merely “very effective” is statistically ridiculous, and validated as such by the resulting statistics themselves.

Can useful information be garnered from the pattern as whole? Perhaps. Statistics aren’t entirely worthless, nor is this variation of statistical application. I’d be in trouble if this was all entirely pointless.  These models and their resulting estimates describe patterns – patterns of test score growth across lots and lots of kids across lots and lots of teachers – and groups and subgroups of kids and teachers. And these models may provide interesting insights into groups and subgroups if the original sample size is large enough. We might find that teachers applying one algebra teaching approach in several schools appear to be advancing students’ measured grasp of key concepts better than teachers in other schools (assuming equal students and settings) applying a different teaching method?

But we would be hard pressed to say with any certainty, which of these teachers are “good teachers” and which are “bad.”

Deconstructing Disinformation on Student Growth Percentiles & Teacher Evaluation in New Jersey

CROSS-POSTED FROM: http://njedpolicy.wordpress.com/

Deconstructing Disinformation on Student Growth Percentiles & Teacher Evaluation in New Jersey (Printable Policy Brief): SGP_Disinformation_BakerOluwole

Bruce D. Baker, Rutgers University, Graduate School of Education

Joseph Oluwole, Montclair State University


Introduction

This brief addresses problems with, and disinformation about New Jersey’s Student Growth Percentile (SGP) measures which are proposed by New Jersey Department of Education officials, to be used for evaluating teachers and principals and rating local public schools. Specifically, the New Jersey Department of Education has proposed that the student growth percentile measures be used as a major component for determining teacher effectiveness:

“If, according to N.J.A.C. 6A:10-4.2(b), a teacher receives a median student growth percentile, the student achievement component shall be at least 35 percent and no more than 50 percent of a teacher’s evaluation rubric rating.” [1]

Yet those ratings of teacher effectiveness may have consequences for employment. Specifically, under proposed regulations, school principals are obligated to notify teachers:

“…in danger of receiving two consecutive years of ineffective or partially effective ratings, which may trigger tenure charges to be brought pursuant to TEACHNJ and N.J.A.C. 6A:3.”[2]

In addition, proposed regulations require that school principals and assistant principals be evaluated based on school aggregate growth percentile data:

“If, according to N.J.A.C. 6A:10-5.2(b), the principal, vice-principal, or assistant principal receives a median student growth percentile measure as described in N.J.A.C. 6A:10-5.2(c) below, the measure shall be at least 20 percent and no greater than 40 percent of evaluation rubric rating as determined by the Department.” [3]

Thus inferring that the median student’s achievement growth in any school may be causally attributed to the principal and/or vice principal.

But, we explain in this brief that student growth percentile data are not up to this task.  In the following brief, we explain that:

  • Student Growth Percentiles are not designed for inferring teacher influence on student outcomes.
  • Student Growth Percentiles do not control for various factors outside of the teacher’s control.
  • Student Growth Percentiles are not backed by research on estimating teacher effectiveness. By contrast, research on SGPs has shown them to be poor at isolating teacher influence.
  • New Jersey’s Student Growth Percentile measures, at the school level, are significantly statistically biased with respect to student population characteristics and average performance level.

Understanding Student Growth Measures

Two broad categories of methods and models have emerged in state policy regarding development and application of measures of student achievement growth to be used in newly adopted teacher evaluation systems. The first general category of methods is known as value-added models (VAMs) and the second as student growth percentiles (SGPs or MGPs, for “median growth percentile”). Several large urban school districts including New York City and Washington, DC have adopted value-added models and numerous states have adopted student growth percentiles for use in accountability systems. Among researchers it is well understood that these are substantively different measures by design, one being a possible component of the other. But these measures and their potential uses have been conflated by policymakers wishing to expedite implementation of new teacher evaluation policies and pilot programs.[4]

Arguably, one reason for the increasing popularity of the SGP approach across states is the extent of highly publicized scrutiny and large and growing body of empirical research over problems with using VAMs for determining teacher effectiveness.[5] Yet, there has been far less research on using student growth percentiles for determining teacher effectiveness. The reason for this vacuum is not that student growth percentiles are simply immune to problems of value-added models, but that researchers have until recently chosen not to evaluate their validity for this purpose – estimating teacher effectiveness – because they are not designed to infer teacher effectiveness.

Two recent working papers compare SGP and VAM estimates for teacher and school evaluation and both raise concerns about the face validity and statistical properties of SGPs. Goldhaber and Walch (2012) conclude: “For the purpose of starting conversations about student achievement, SGPs might be a useful tool, but one might wish to use a different methodology for rewarding teacher performance or making high-stakes teacher selection decisions” (p. 30).[6] Ehlert and colleagues (2012) note: “Although SGPs are currently employed for this purpose by several states, we argue that they (a) cannot be used for causal inference (nor were they designed to be used as such) and (b) are the least successful of the three models [Student Growth Percentiles, One-Step VAM & Two-Step VAM] in leveling the playing field across schools” (p. 23).[7]

A value-added estimate uses assessment data in the context of a statistical model (regression analysis), where the objective is to estimate the extent to which a student having a specific teacher or attending a specific school influences that student’s difference in score from the beginning of the year to the end of the year – or period of treatment (in school or with teacher). The most thorough of VAMs, more often used in research than practice, attempt to account for: (a) the student’s prior multi-year gain trajectory, by using several prior year test scores (to isolate the extent that having a certain teacher alters that trajectory), (b) the classroom level mix of student peers, (c) individual student background characteristics, and (d) possibly school level characteristics. The goal is to identify most accurately the share of the student’s or group of students’ value-added that should be attributed to the teacher as opposed to other factors outside of the teachers’ control. Corrections such as using multiple years of prior student scores dramatically reduces the number of teachers who may be assigned ratings. For example, when Briggs and Domingue (2011) estimate alternative models to the LA Times (Los Angeles Unified School District) data using additional prior scores, the number of teachers rated drops from about 8,000 to only 3,300, because estimates can only be determined for teachers in grade 5 and above. [8] As such, these important corrections are rarely included in models used for actual teacher evaluation.

By contrast, a student growth percentile is a descriptive measure of the relative change of a student’s performance compared to that of all students.  That is, the individual scores obtained on these underlying tests are used to construct an index of student growth, where the median student, for example, may serve as a baseline for comparison. Some students have achievement growth on the underlying tests that is greater than the median student, while others have growth from one test to the next that is less. That is, the approach estimates not how much the underlying scores changed, but how much the student moved within the mix of other students taking the same assessments.  It uses a method called quantile regression to estimate the rarity that a child falls in her current position in the distribution, given her past position in the distribution (Briggs & Betebenner, 2009).[9]   Student growth percentile measures may be used to characterize each individual student’s growth, or may be aggregated to the classroom level or school level, and/or across children who started at similar points in the distribution to attempt to characterize the collective growth of groups of students.

Many, if not most value-added models also involve normative rescaling of student achievement data, measuring in relative terms how much individual students or groups of students have moved within the large mix of students. The key difference is that the value-added models include other factors in an attempt to identify the extent to which having a specific teacher contributed to that growth, whereas student growth percentiles are simply a descriptive measure of the growth itself.

SGPs can be hybridized with VAMs, by conditioning the descriptive student growth measure on student demographic characteristics. New York State has adopted such a model. However, the state’s own technical report found “Despite the model conditioning on prior year test scores, schools and teachers with students who had higher prior year test scores, on average, had higher MGPs. Teachers of classes with higher percentages of economically disadvantaged students had lower MGPs(p. 1).[10]

Value-added models while intended to estimate teacher effects on student achievement growth, largely fail to do so in any accurate or precise way, whereas student growth percentiles make no such attempt.[11] Specifically, value-added measures tend to be highly unstable from year to year, and have very wide error ranges when applied to individual teachers, making confident distinctions between “good” and “bad” teachers difficult if not impossible.[12]  Furthermore, while value-added models attempt to isolate that portion of student achievement growth that is caused by having a specific teacher they often fail to do so and it is difficult if not impossible to discern a) how much the estimates have failed and b) in which direction for which teachers. That is, the individual teacher estimates may be biased by factors not fully addressed in the models and researchers have no clear way of knowing how much. We also know that when different tests are used for the same content, teachers receive widely varying ratings, raising additional questions about the validity of the measures.[13]

While we have substantially less information from existing research on student growth percentiles, it stands to reason that since they are based on the same types of testing data, they will be similarly susceptible to error and noise. But more troubling, since student growth percentiles make no attempt (by design) to consider other factors that contribute to student achievement growth, the measures have significant potential for omitted variables bias.  SGPs leave the interpreter of the data to naively infer (by omission) that all growth among students in the classroom of a given teacher must be associated with that teacher. Research on VAMs indicates that even subtle changes to explanatory variables in value-added models change substantively the ratings of individual.[14] Omitting key variables can lead to bias and including them can reduce that bias.  Excluding all potential explanatory variables, as do SGPs, takes this problem to the extreme by simply ignoring the possibility of omitted variables bias while omitting a plethora of widely used explanatory variables. As a result, it may turn out that SGP measures at the teacher level appear more stable from year to year than value-added estimates, but that stability may be entirely a function of teachers serving similar populations of students from year to year. The measures may contain stable omitted variables bias, and thus may be stable in their invalidity. Put bluntly, SGPs may be more consistent by being more consistently wrong.

In defense of Student Growth Percentiles as accountability measures, Betebenner, Wenning and Briggs (2011) explain that one school of thought is that value-added estimates are also most reasonably interpreted as descriptive measures, and should not be used to infer teacher or school effectiveness: “The development of the Student Growth Percentile methodology was guided by Rubin et al’s (2004) admonition that VAM quantities are, at best, descriptive measures”.[15] Rubin, Stuart, and Zanutto (2004) explain:

Value-added assessment is a complex issue, and we appreciate the efforts of Ballou et al. (2004), McCaffrey et al. (2004) and Tekwe et al. (2004). However, we do not think that their analyses are estimating causal quantities, except under extreme and unrealistic assumptions. We argue that models such as these should not be seen as estimating causal effects of teachers or schools, but rather as providing descriptive measures (Rubin et al., 2004, p. 18).[16]

Arguably, these explanations do less to validate the usefulness of Student Growth Percentiles as accountability measures (inferring attribution and/or responsibility to schools and teachers) and far more to invalidate the usefulness of both Student Growth Percentiles and Value-Added Models for these purposes.

Do Growth Percentiles Fully Account for Student Background?

New Jersey has recently released its new regulations for implementing teacher evaluation policies, with heavy reliance on student growth percentile scores, aggregated to the teacher level as median growth percentiles (using the growth percentile of the median student in any class as representing the teacher effect). When recently challenged about whether those growth percentile scores will accurately represent teacher effectiveness, specifically for teachers serving kids from different backgrounds, NJ Commissioner Christopher Cerf explained:

“You are looking at the progress students make and that fully takes into account socio-economic status,” Cerf said. “By focusing on the starting point, it equalizes for things like special education and poverty and so on.”[17] (emphasis added)

There are two issues with this statement. First, comparisons of individual students don’t actually explain what happens when a group of students is aggregated to their teacher and the teacher is assigned the median student’s growth score to represent his/her effectiveness, where teachers don’t all have an evenly distributed mix of kids who started at similar points (to other teachers). So, in one sense, this statement doesn’t even address the issue.

Second, this statement is simply factually incorrect, even regarding the individual student. The statement is not supported by research on estimating teacher effects which largely finds that sufficiently precise student, classroom and school level factors do relate to variations not only in initial performance level but also in performance gains. Those cases where covariates have been found to have only small effects are likely those in which effects are either drowned out by particularly noisy outcome measures, problems resulting from underlying test scaling (or re-scaling) or poorly measured student characteristics. Re-analysis of teacher ratings from the Los Angeles Times analysis, using richer data and more complex value-added models yielded substantive changes to teacher ratings.[18] The Los Angeles Times model already included far more attempts to capture student characteristics than New Jersey’s Growth Percentile Model – which includes none.

At a practical level, it is relatively easy to understand how and why student background characteristics affect not only their initial performance level but also their achievement growth. Consider that one year’s assessment is given in April. The school year ends in late June. The next year’s test is given the next April. First, there are approximately two months of instruction given by the prior year’s teacher that are assigned to the current year’s teacher. Beyond that, there are a multitude of things that go on outside of the few hours a day where the teacher has contact with a child, that influence any given child’s “gains” over the year, and those things that go on outside of school vary widely by children’s economic status. Further, children with certain life experiences on a continued daily, weekly and monthly basis are more likely to be clustered with each other in schools and classrooms.

With annual test scores, differences in summer experiences which vary by student economic background matter. Lower income students experience much lower achievement gains than their higher income peers over the summer.[19] Even the recent Gates Foundation Measures of Effective Teaching Project, which used fall and spring assessments, found that “students improve their reading comprehension scores as much (or more) between April and October as between October and April in the following grade.”(p. 8)[20] That is, gains and/or losses may be as great during the time period when children have no direct contact with their teachers or schools. Thus, it is rather absurd to assume that teachers can and should be evaluated based on these data.

Even during the school year, differences in home settings and access to home resources matter, and differences in access to outside of school tutoring and other family subsidized supports may matter and depend on family resources. [21] Variations in kids’ daily lives more generally matter (neighborhood violence, etc.) and many of those variations exist as a function of socio-economic status. Variations in peer group with whom children attend school matters,[22] and also varies by socio-economic status, neighborhood structure, conditions, and varies by socioeconomic status of not just the individual child, but the group of children.

In short, it is inaccurate to suggest that using the same starting point “fully takes into account socio-economic status.” It’s certainly false to make such a statement about aggregated group comparisons – especially while never actually conducting or producing publicly any analysis to back such a claim.

Did the Gates Foundation Measures of Effective Teaching Study Validate Use of Growth Percentiles?

Another claim used in defense of New Jersey’s growth percentile measures is that a series of studies conducted with funding from the Bill and Melinda Gates Foundation provide validation that these measures are indeed useful for evaluating teachers. In a recent article by New Jersey journalist John Mooney in his online publication NJ Spotlight, state officials were asked to respond to some of the above challenges regarding growth percentile measures. Along with perpetuating the claim that the growth percentile model takes fully into account student background, state officials also issued the following response:

The Christie administration cites its own research to back up its plans, the most favored being the recent Measures of Effective Teaching (MET) project funded by the Gates Foundation, which tracked 3,000 teachers over three years and found that student achievement measures in general are a critical component in determining a teacher’s effectiveness.”[23]

The Gates Foundation MET project did not study the use of Student Growth Percentile Models. Rather, the Gates Foundation MET project studied the use of value-added models, applying those models under the direction of leading researchers in the field, testing their effects on fall to spring gains, and on alternative forms of assessments. Even with these more thoroughly vetted value-added models, the Gates MET project uncovered, though largely ignored, numerous serious concerns regarding the use of value-added metrics. External reviewers of the Gates MET project reports pointed out that while the MET researchers maintained their support for the method, the actual findings of their report cast serious doubt on its usefulness.[24]

The Gates Foundation MET project results provide no basis for arguing that student growth percentile measures should have a substantial place in teacher evaluation.  The Gates MET project never addressed student growth percentiles. Rather, it attempted a more thorough, more appropriate method, but provided results which cast serious doubt on the usefulness of even that method.  Those who have compared the relative usefulness of growth percentiles and value-added metrics have found growth percentiles sorely lacking as a method for sorting out teacher influence on student gains.[25]

What do We Know about New Jersey’s Growth Percentile Measures?

Unfortunately, the New Jersey Department of Education has a) not released any detailed teacher-level growth percentile data for external evaluation or review, b) unlike other states pursuing value-added and/or growth metrics has chosen not to convene a technical review panel and c) unlike other states pursuing these methods, has chosen not to produce any detailed technical documentation or analysis of their growth percentile data. Yet, they have chosen to issue regulations regarding how these data must be used directly in consequential employment decisions. This is unacceptable.

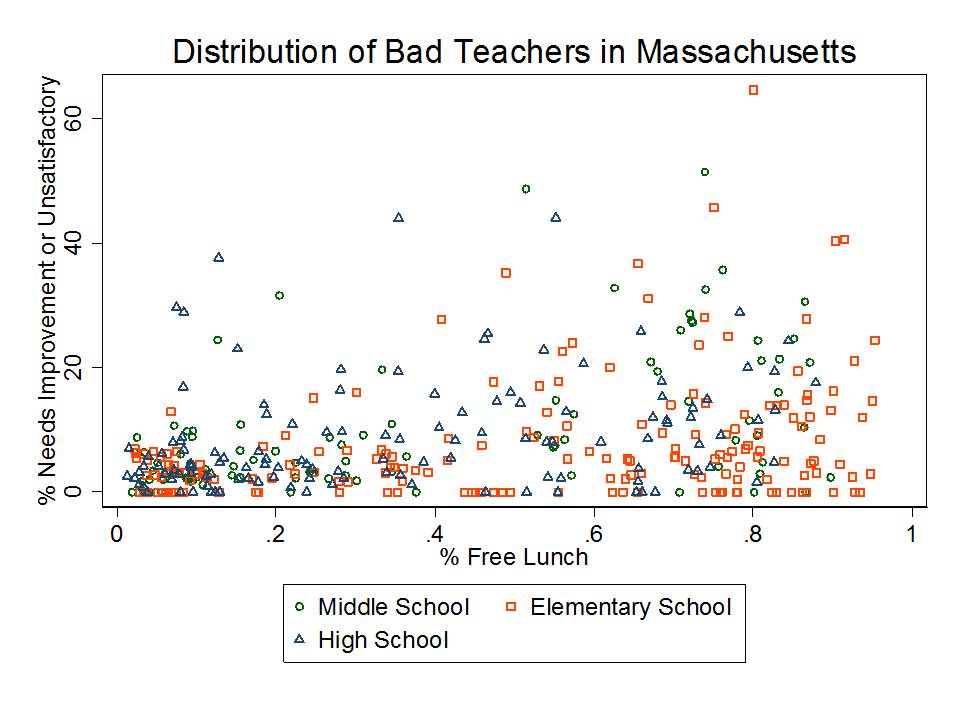
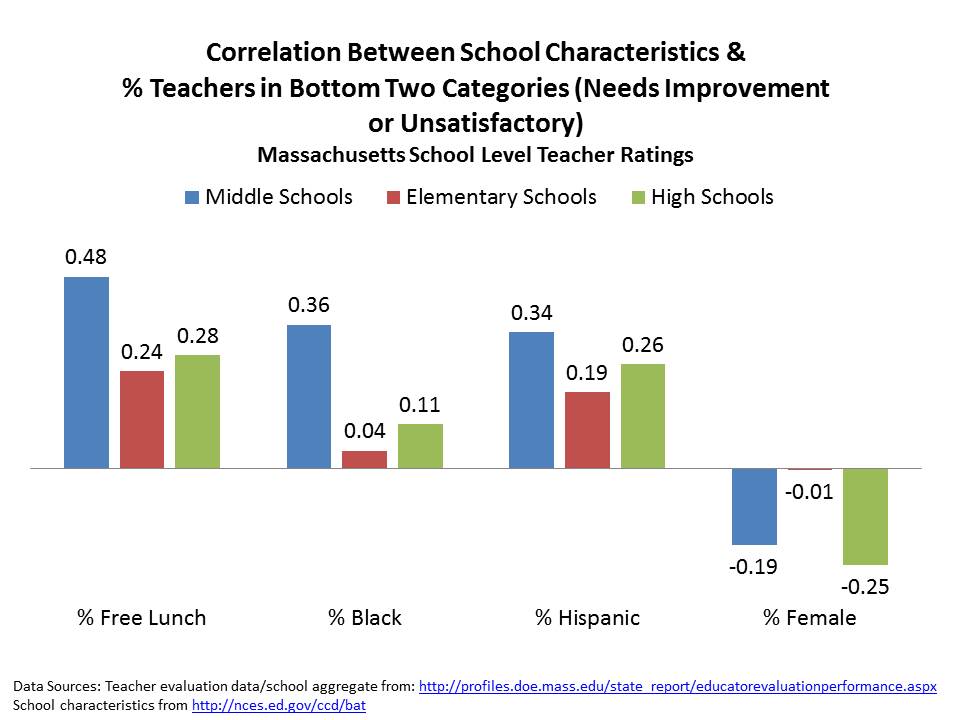
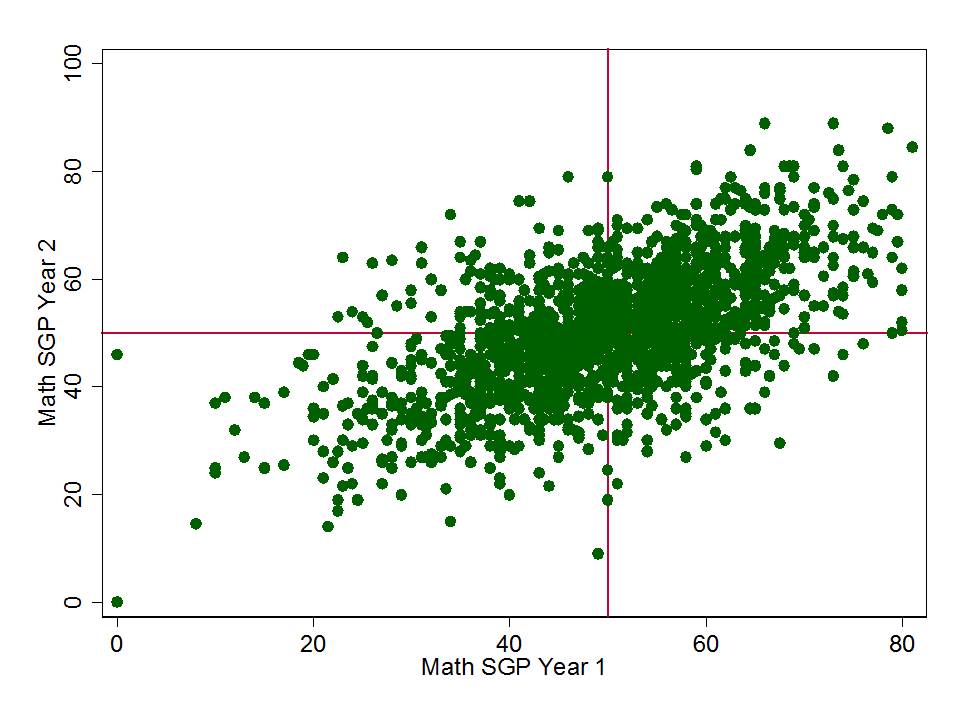
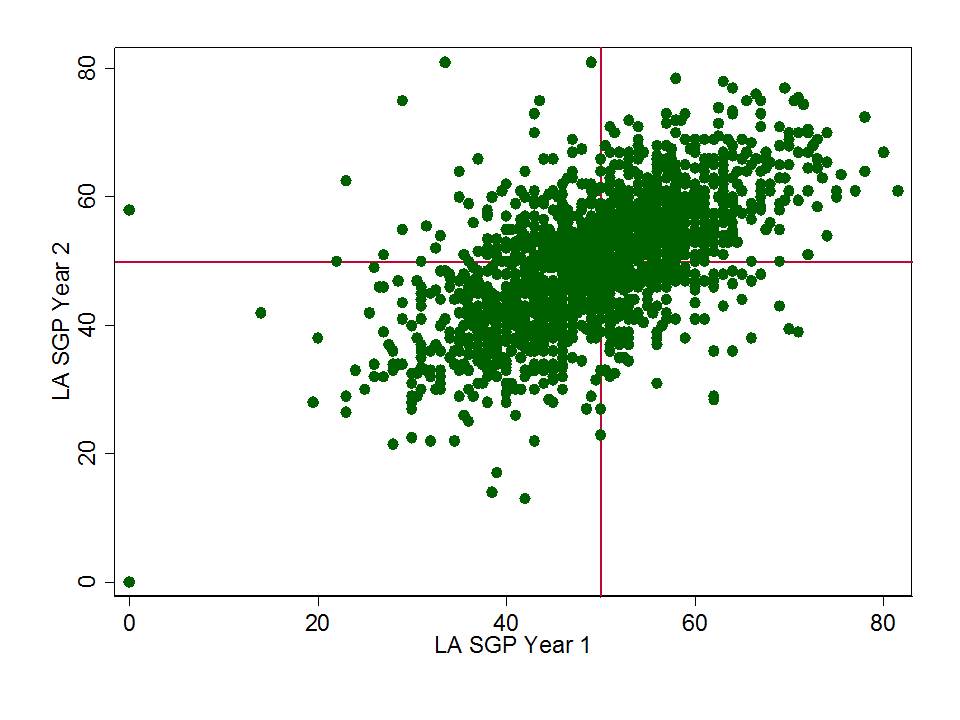
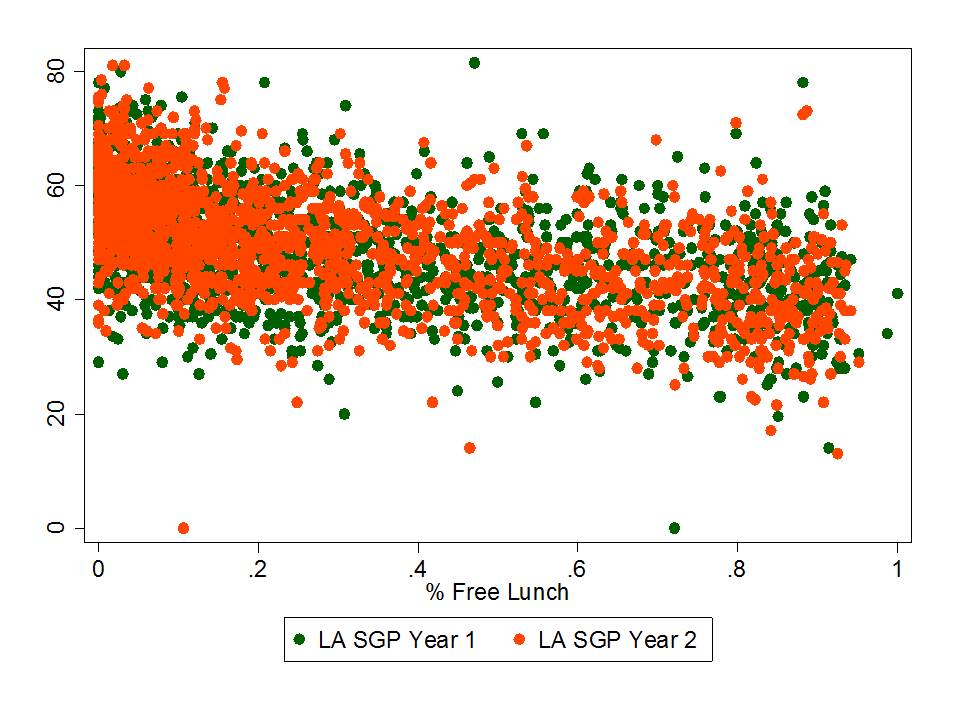
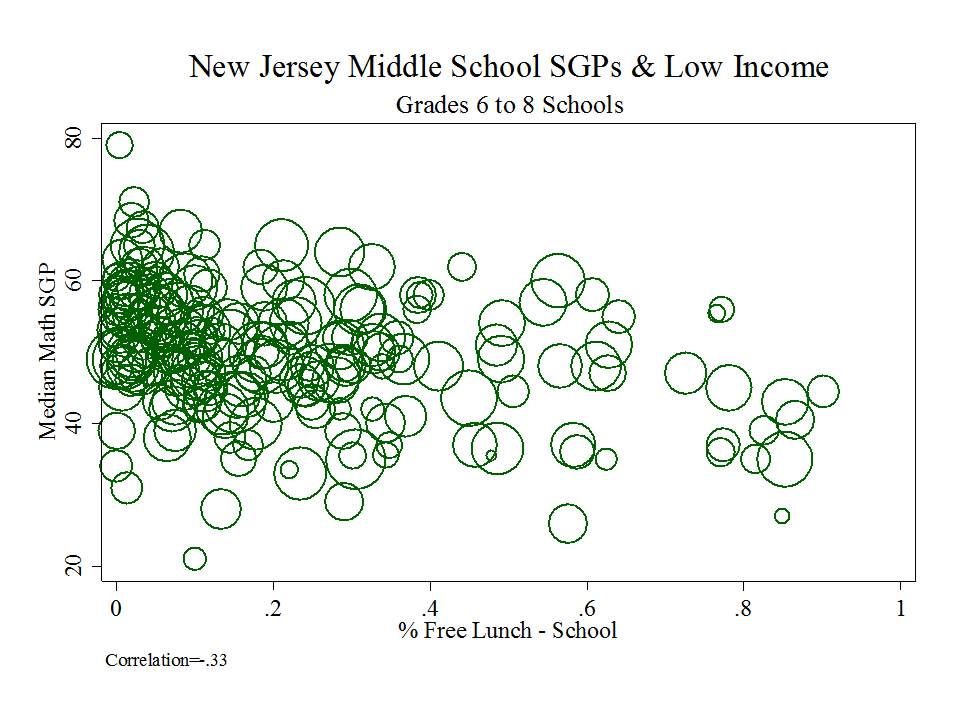
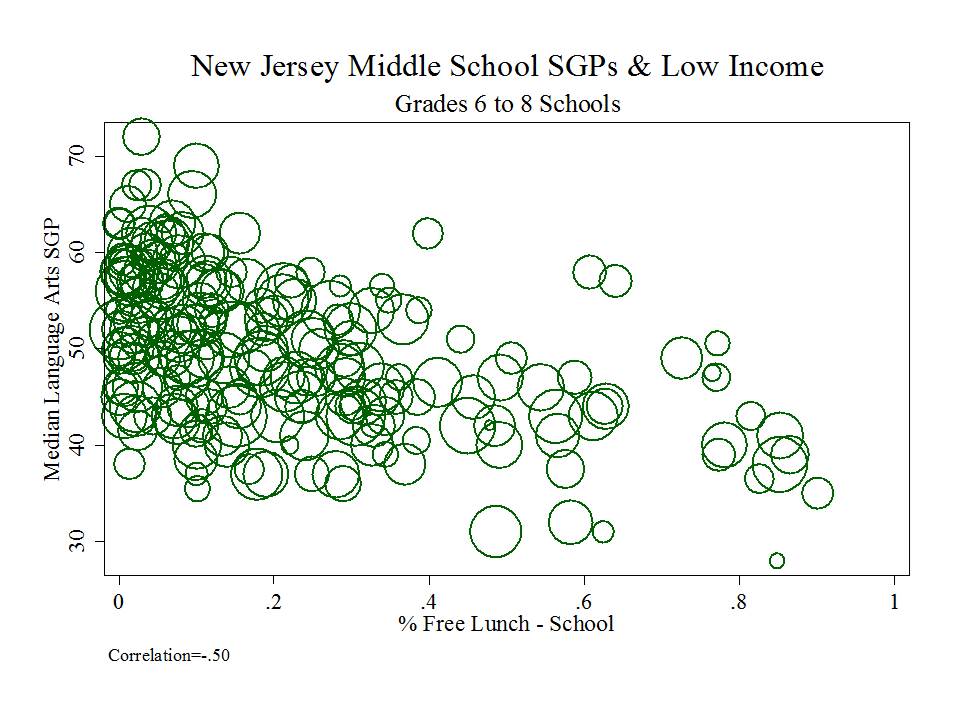
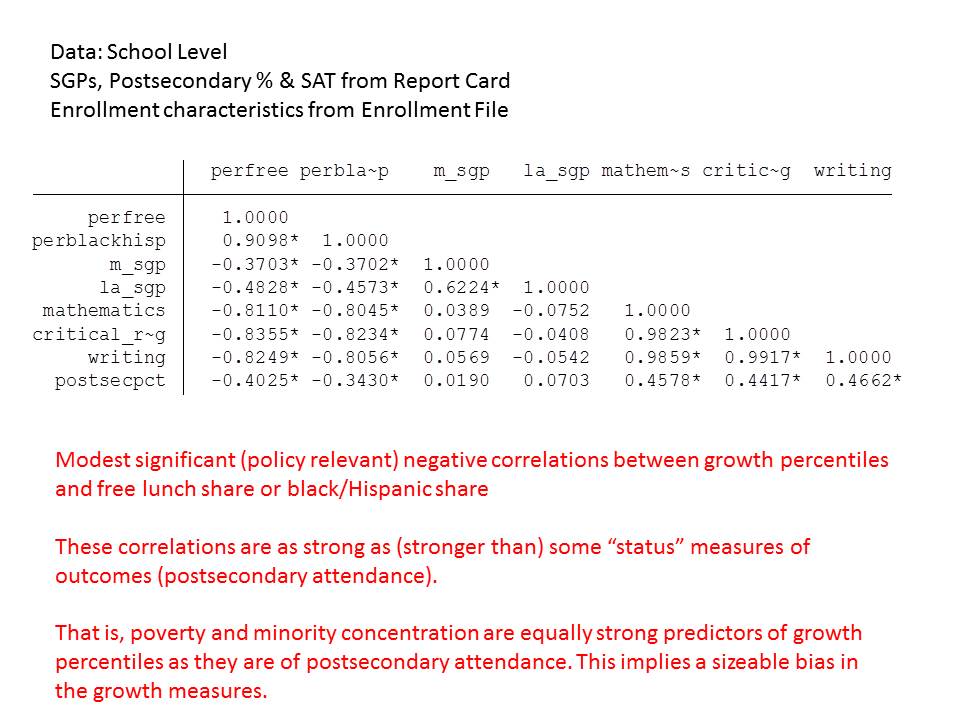
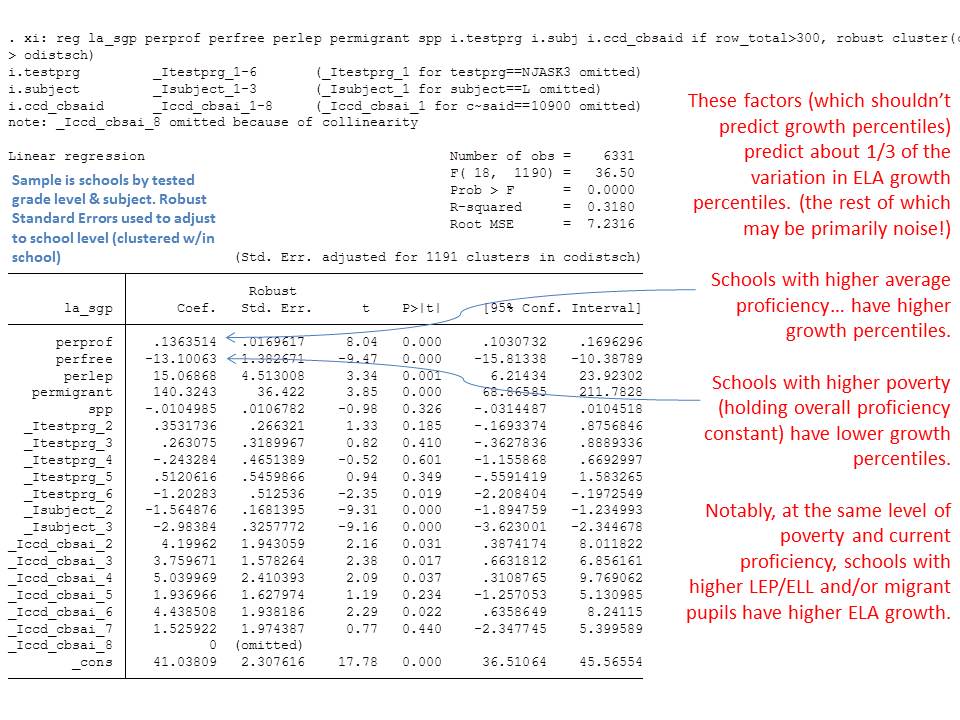
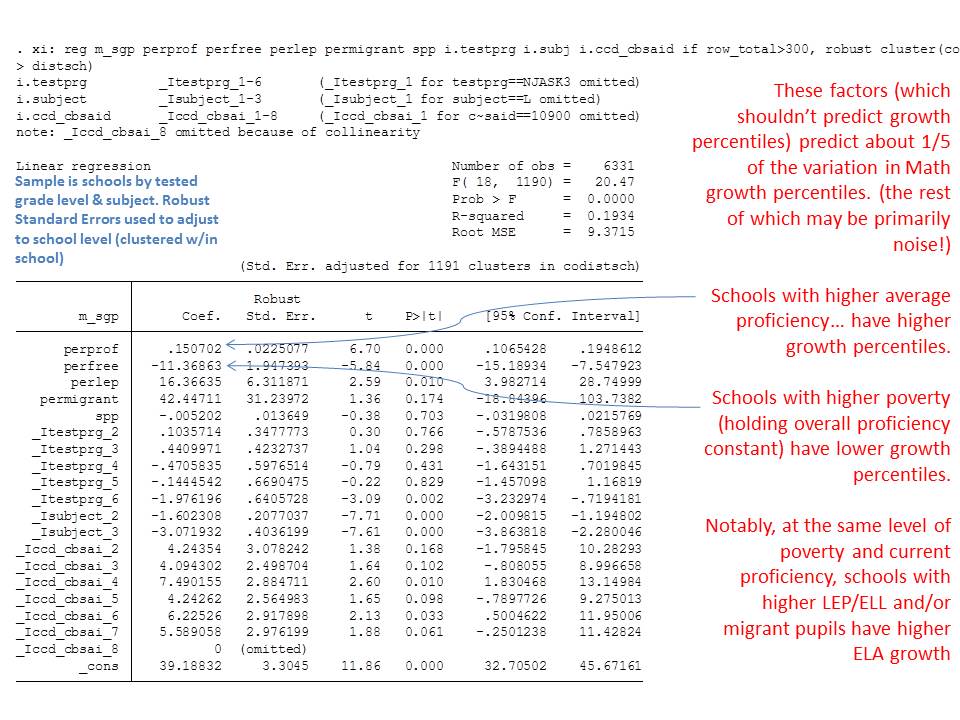
The state has released as part of its school report cards, school aggregate median growth percentile data, which shed some light on the possible extent of the problems with their current measures.  A relatively straightforward statistical check on the distributional characteristics of these measures is to evaluate the extent to which they relate to measures of student population characteristics. That is, to what extent do we see that higher poverty schools have lower growth percentiles, or to what extent do we see that schools with higher average performing peer groups have higher average growth percentiles. Evidence of correlation with either might be indicative of statistical bias- specifically omitted variables bias.

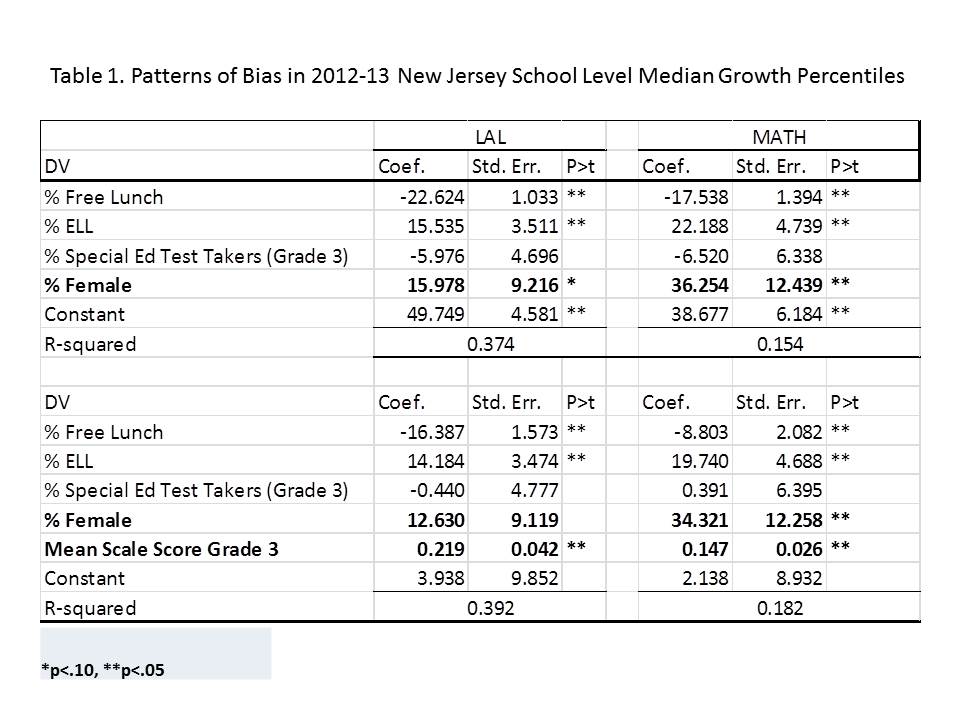
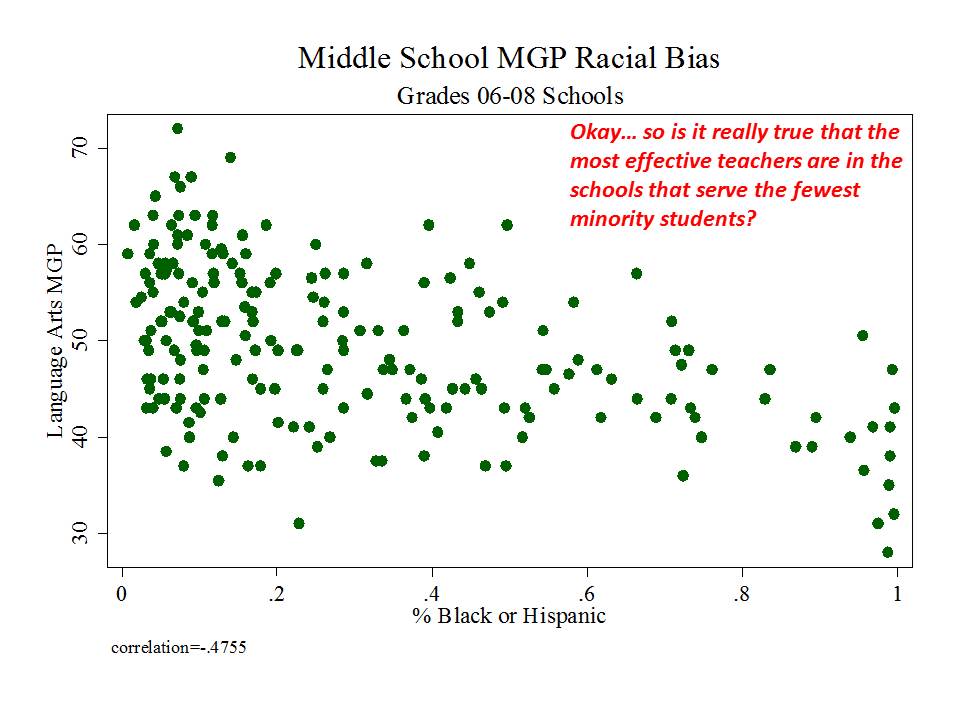
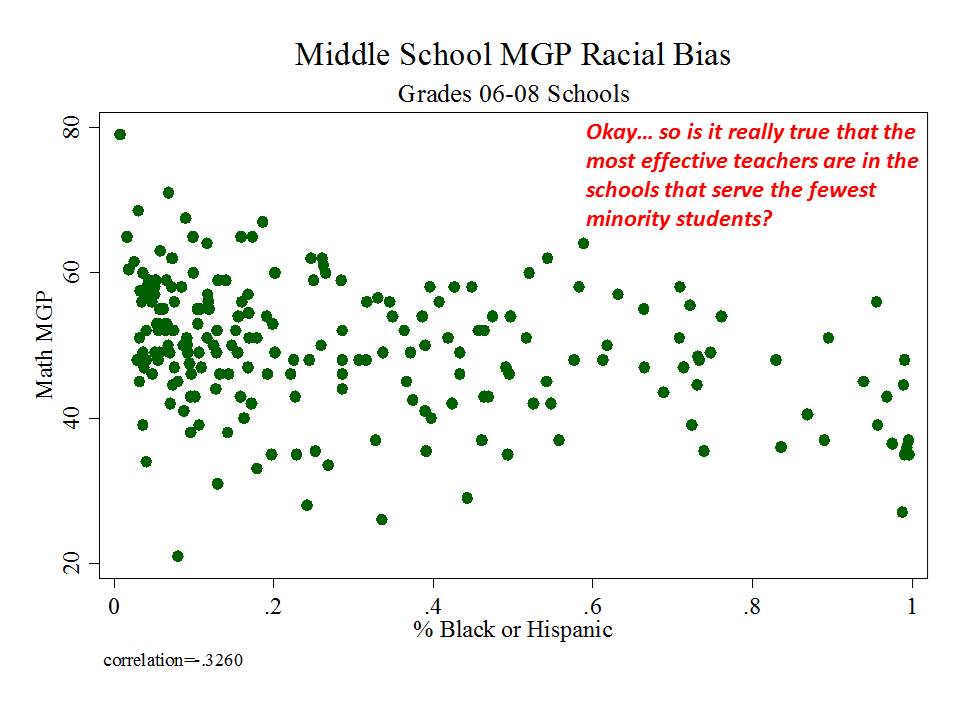
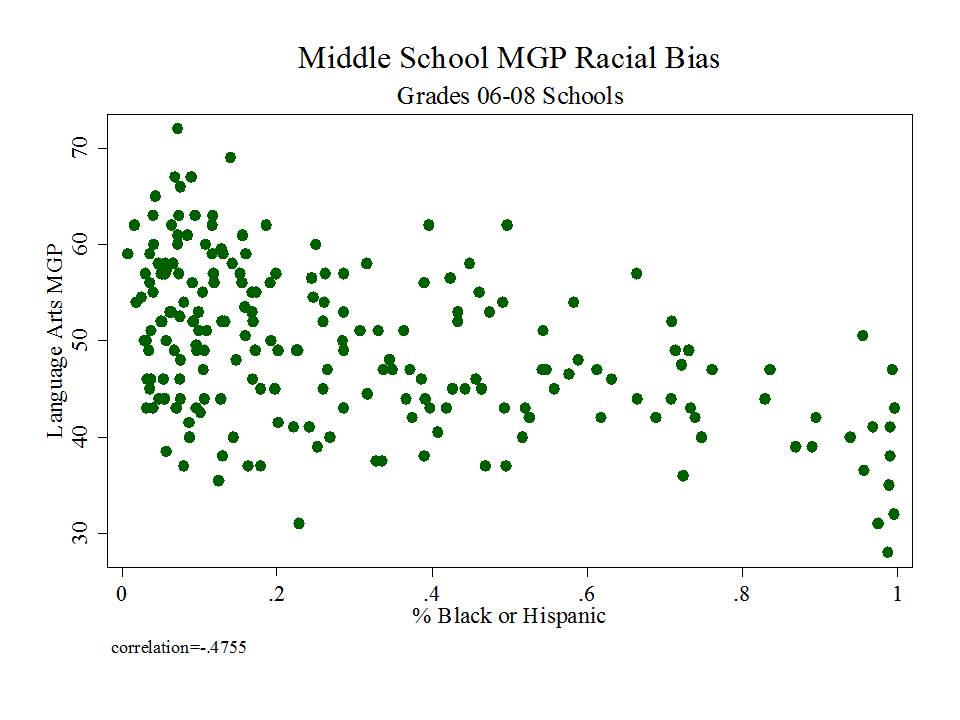
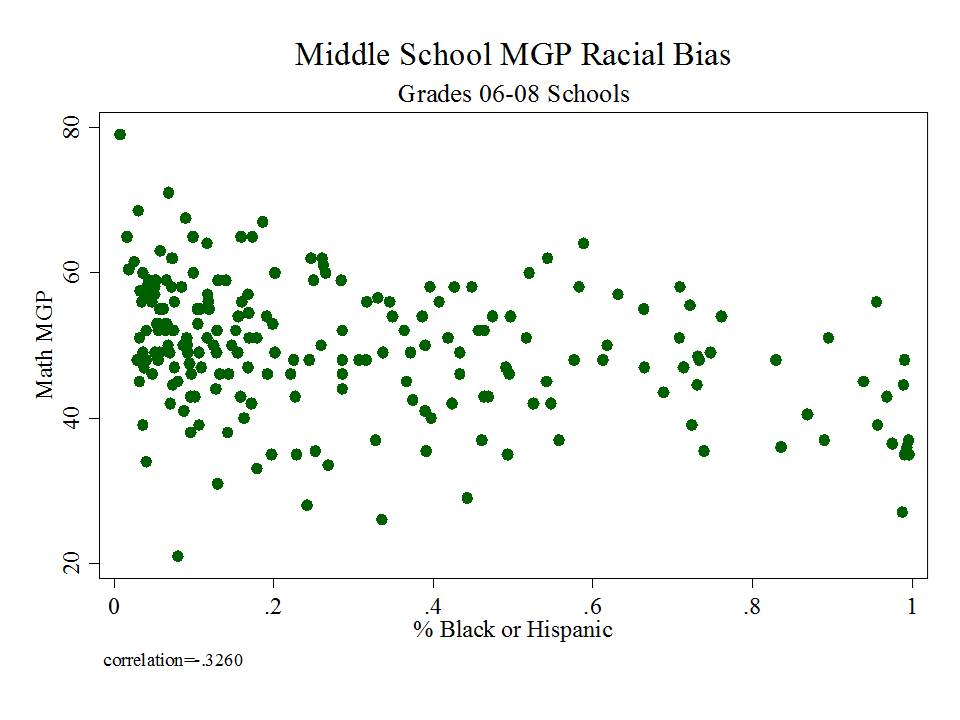
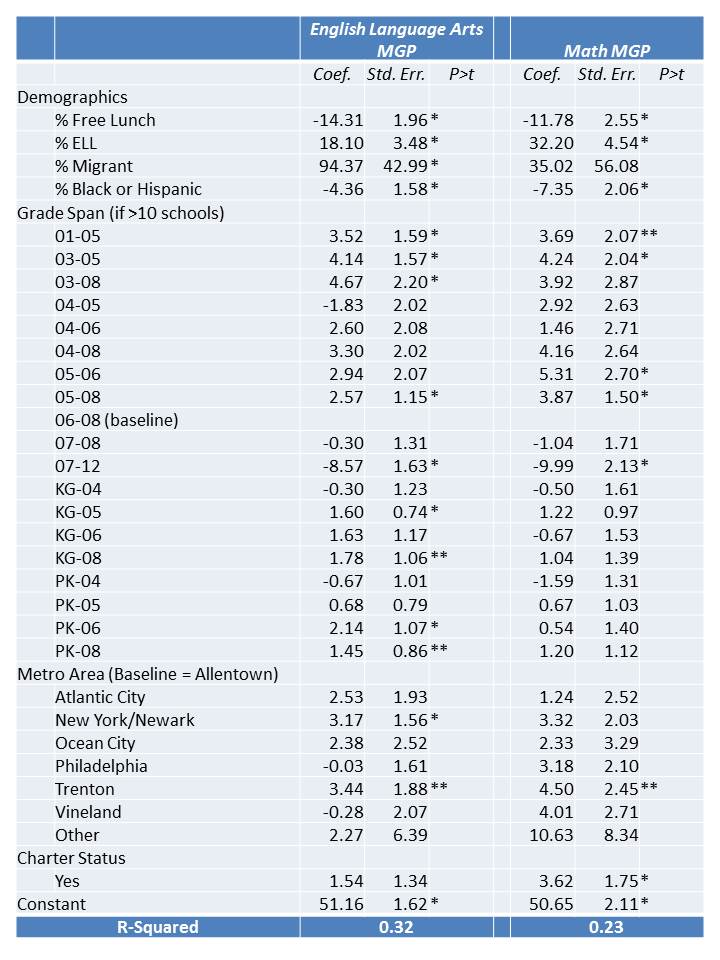
Table 1 below uses school level data from the recently released New Jersey School Report Cards databases, combined with student demographic data from the New Jersey Fall Enrollment Reports.  For both ELA and Math growth percentile measures, there exist modest, negative statistically significant correlations with school level % free lunch, and with school level % black or Hispanic.

Higher shares of low income children and higher shares of minority children are each associated with lower average growth percentiles.  This finding validates that the growth percentile measures – which fail on their face to take into account student background characteristics – as a result fail statistically to remove the bias associated with these measures.

To simplify, there exist three types of variation in the growth percentile measures: 1) variation that may in fact be associated with a given teacher or school, 2) variation that may be associated with factors other than the school or teacher (omitted variables bias) and 3) statistical/measurement noise.

The difficulty here is our inability to determine which type of variation is “true effect”, which is the “effect of some other factor” and which is “random noise.” Here, we can see that a sizeable share of the variance in growth is associated with school demographics (“Some other factor”). One might assert that this pattern occurs simply because good teachers sort into schools with fewer low income and minority children, who are then left with bad teachers unable to produce gains. Such an assertion cannot be supported with these data, given the equal (if not greater) likelihood that these patterns occur as a function of omitted variables bias – where all possible variables have actually been omitted (proxied only with a single prior score).

Pursuing a policy of dismissing or detenuring at a higher rate, teachers in high poverty schools because of their lower growth percentiles, would be misguided. Doing so would create more instability and disruption in settings already disadvantaged, and may significantly reduce the likelihood that these schools could then recruit “better” teachers as replacements.

Table 1

% Free Lunch

% Black or Hispanic

% Black or Hispanic

0.9098*

Math MGP

-0.3703*

-0.3702*

ELA MGP

-0.4828*

-0.4573*

*p<.05

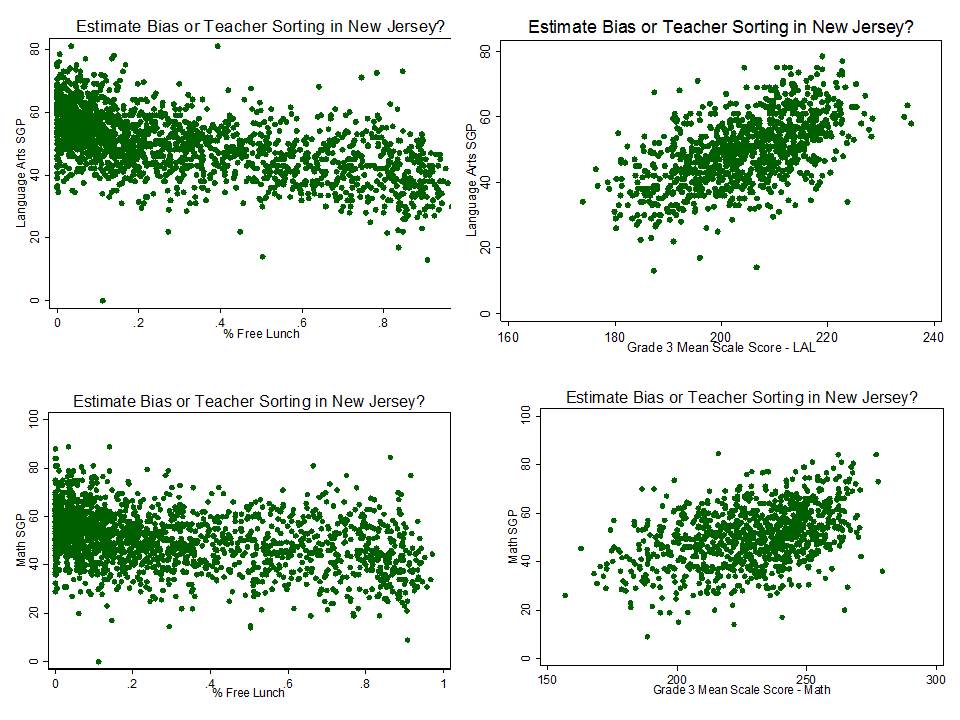
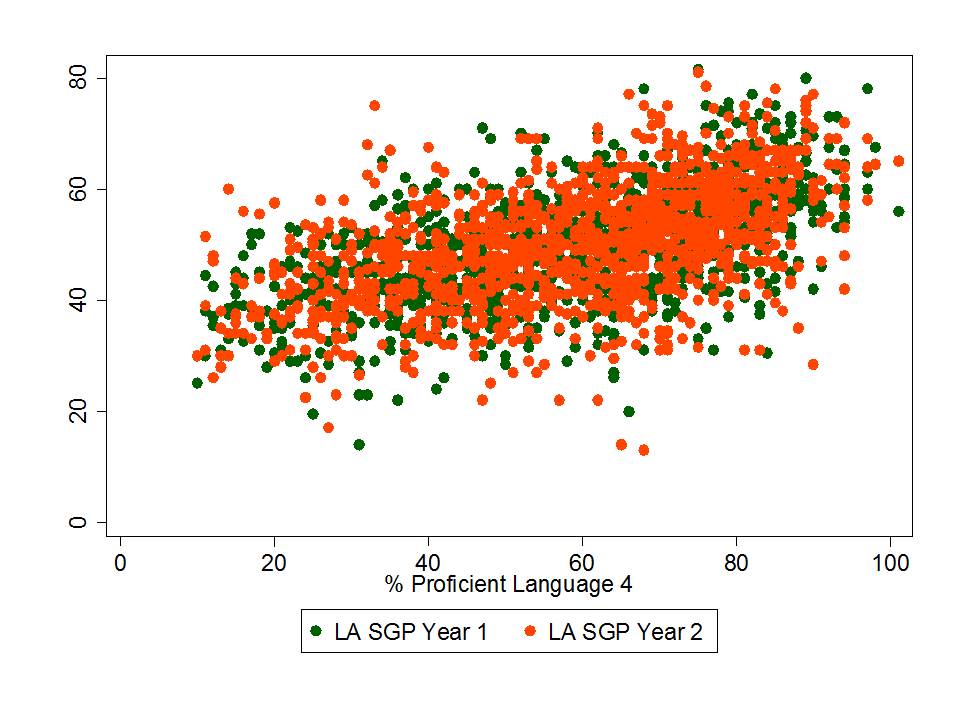
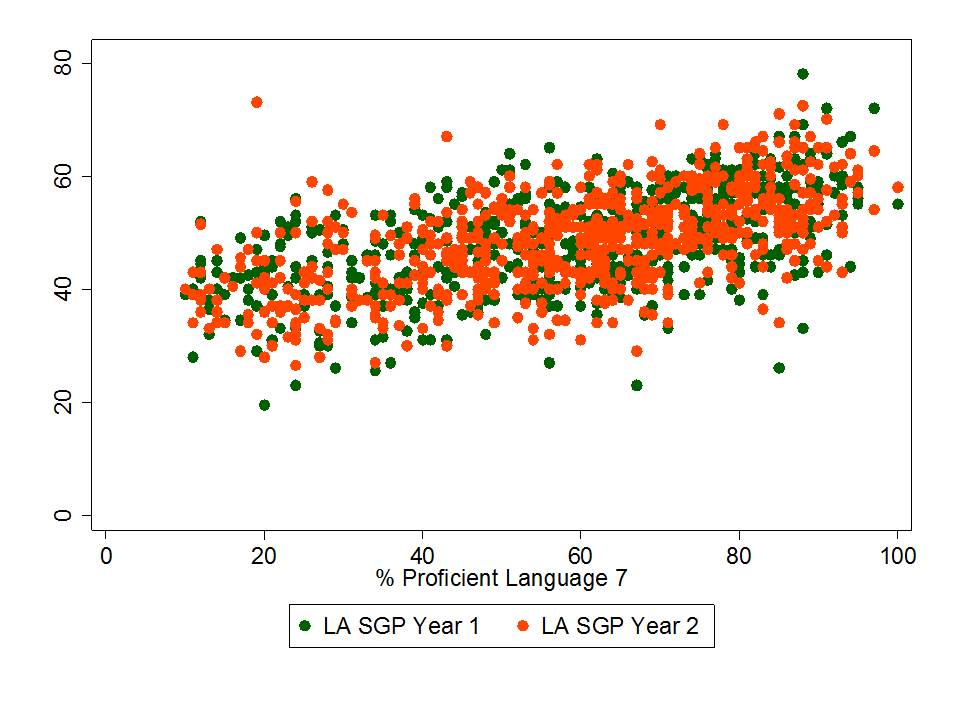
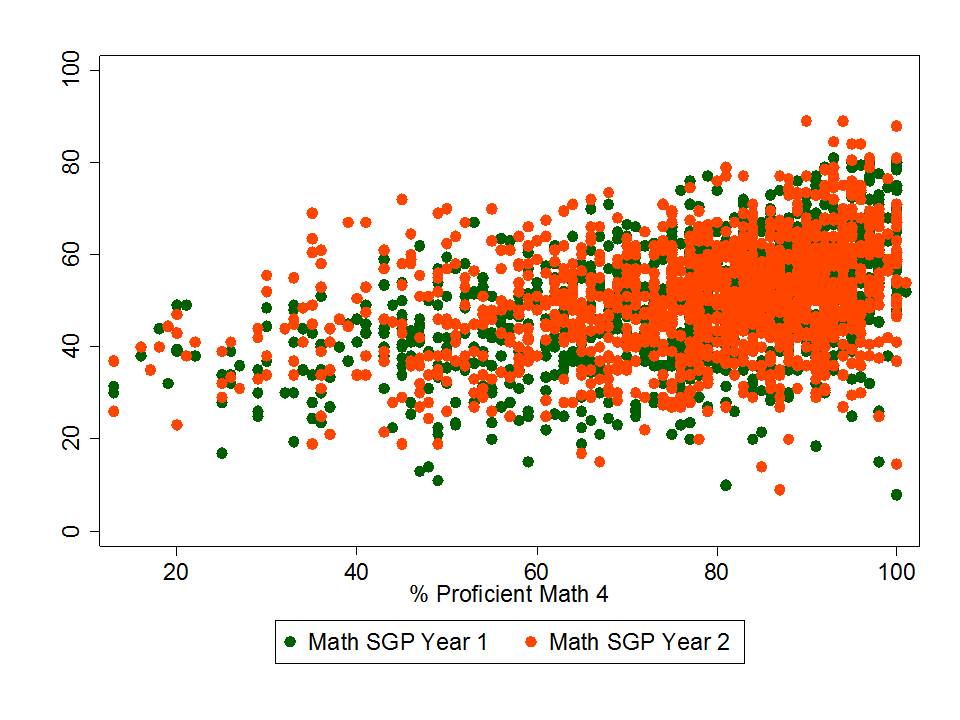
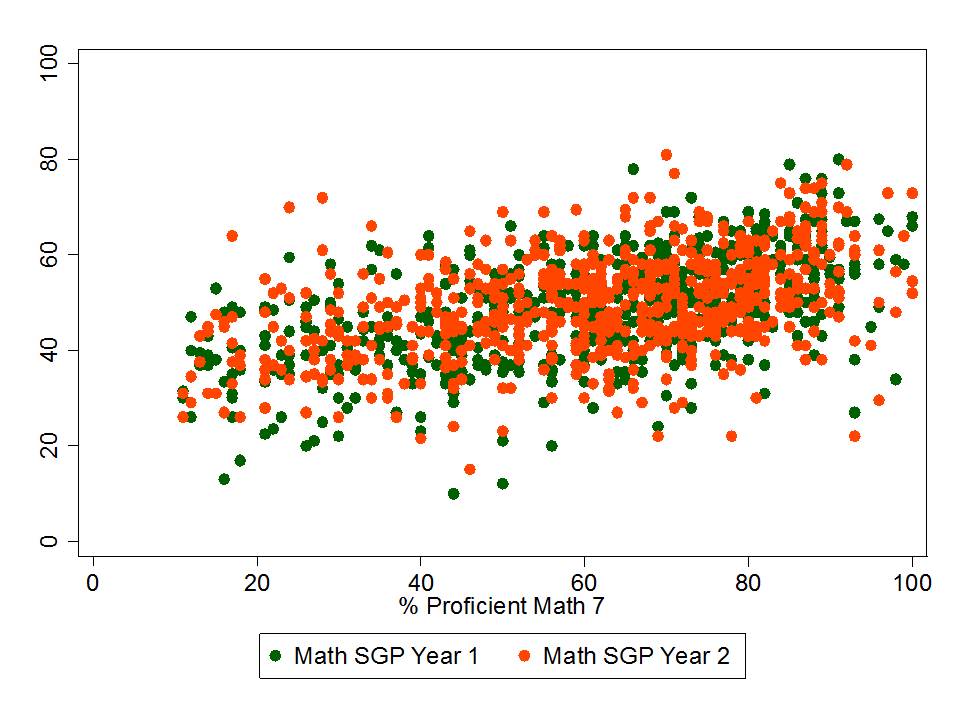
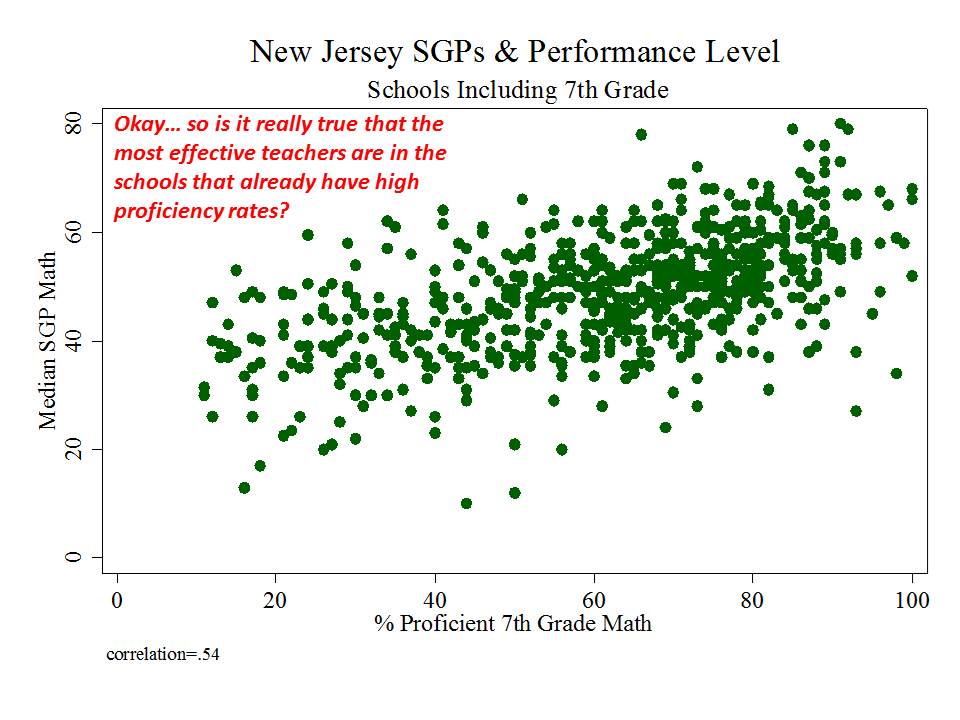
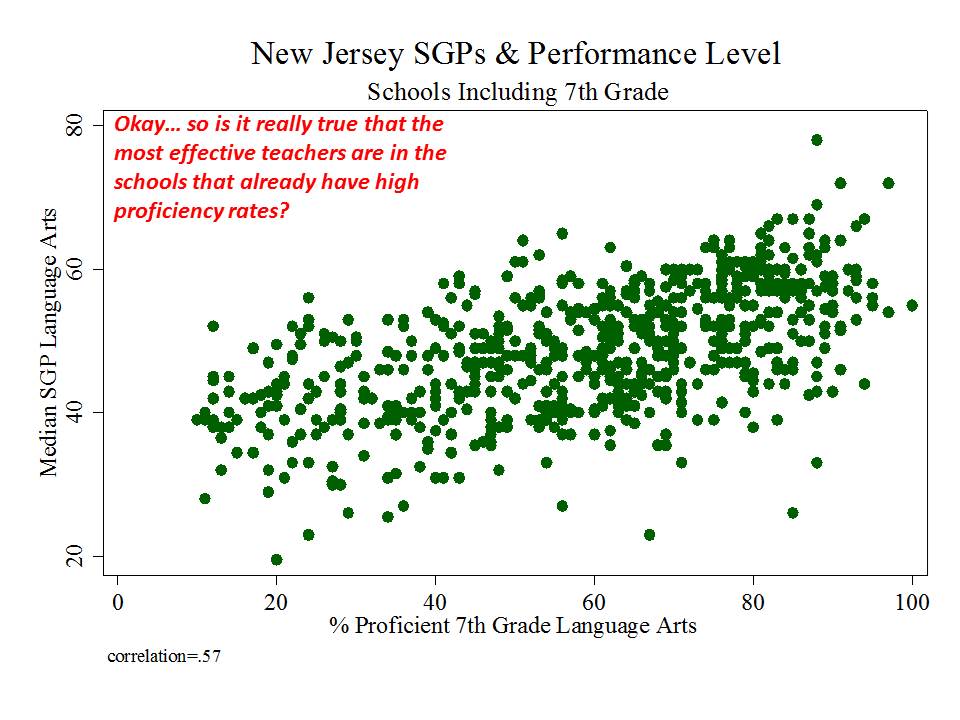
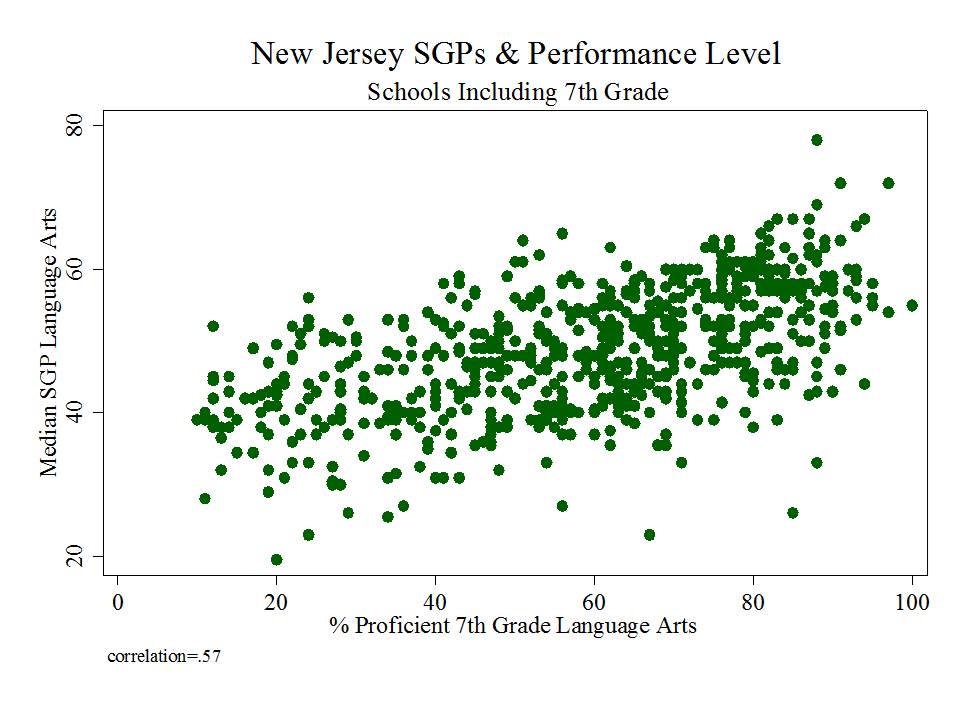
Figure 1 shows the clarity of the pattern of relationship between school average proficiency rates (for 7th graders) and growth percentiles. Here, we see that schools with higher average performance also have significantly higher growth percentiles. This may occur for a variety of reasons. First, it may just be that along higher regions of the underlying test scale, higher gains are more easily attainable. Second, it may be that peer group average initial performance plays a significant role in influencing gains. Third, it may be that to some extent, higher performing schools do have some higher value-added teachers.

The available data do not permit us to fully distinguish which of these three factors most drives this pattern, and the first two of these factors have little or nothing to do with teacher or teaching quality. This uncertainty raises issues of fairness and reliability; particularly, in an evaluation system that has implications for teacher tenure and other employment.

Figure 1

Slide1

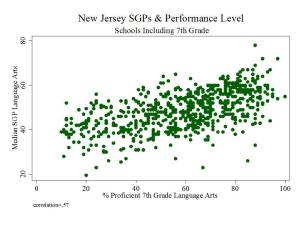
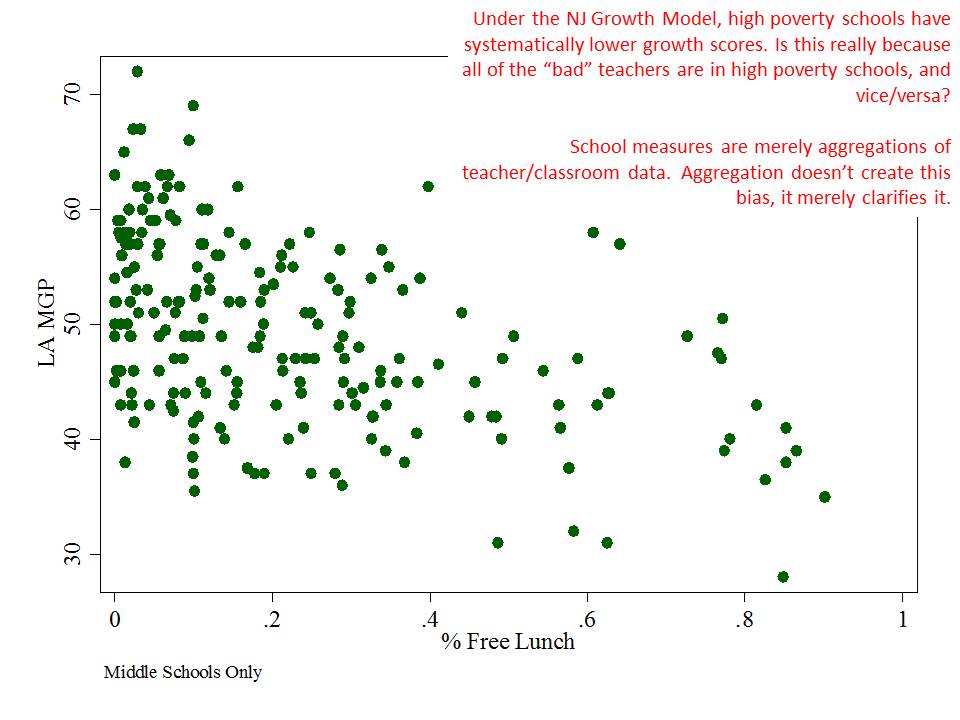
Figure 2 elaborates on the negative relationship between student low income status and school level growth percentiles, showing that among very high poverty schools, growth percentiles tend to be particularly low.

Figure 2

Slide2

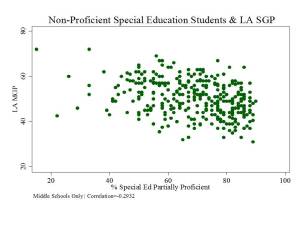
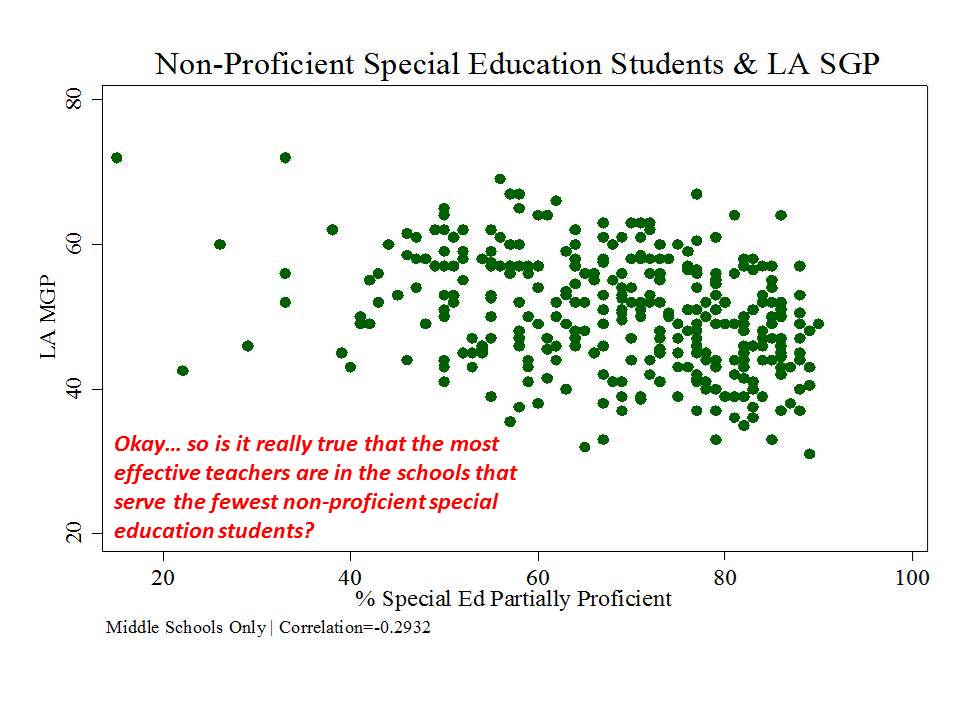
Figure 3 shows that the share of special education children scoring non-(partially)-proficient also seems to be a drag on school level growth percentiles. Schools with larger shares of partially proficient special education students tend to have lower median growth percentiles.

Figure 3

Slide3

An important note here is that these are school level aggregations and much of the intent of state policy is to apply these growth percentiles for evaluating teachers. School growth percentiles are merely aggregations of the handful of teachers for whom rating exist in any school. Bias that appears at the school level is not created by the aggregation. It may be clarified by the aggregation. But if the school level data are biased, then so too are the underlying teacher level data.

What Incentives and Consequences Result from these Measures?

The consequences of adopting these measures for high stakes use in policy and practice are significant.

Rating Schools for Intervention

Growth measures are generally assumed to be better indicators of school performance and less influenced by student background than status measures. Status measures include proficiency rates commonly adopted for compliance with the Federal No Child Left Behind Act.  Using status measures disparately penalizes high poverty, high minority concentration schools, increasing the likelihood that these schools face sanctions including disruptive interventions such as closure or reconstitution. While less biased than status measures, New Jersey’s Student Growth Percentile measures appear to retain substantial bias with respect to student population characteristics and with respect to average performance levels, calling into question their usefulness for characterizing school (and by extension school leader) effectiveness. Further, the measures simply aren’t designed for making such assertions.

Further, if these measures are employed to impose disruptive interventions on high poverty, minority concentration schools, this use will exacerbate the existing disincentive for teachers or principals to seek employment in these schools. If the growth percentiles systematically disadvantage schools with more low income children and non-proficient special education children, relying on these measures will also reinforce current incentives for high performing charter schools to avoid low income children and children with disabilities.

Employment Decisions

First and foremost, SGPs are not designed for inferring the teacher’s effect on student test score change and as such they should not be used that way. It simply does not comport with fairness to continue to use SGPs for an end for which they were not designed. Second, New Jersey’s SGPs retain substantial bias at the school level, indicating that they are likely a very poor indicator of teacher influence. The SGP creates a risk that a teacher will be erroneously deprived of a property right in tenure, consequently creating due process problems. In essence, these two concerns about SGP raise serious issues of validity and reliability. Continued reliance on an invalid/unreliable model borders on arbitrariness.

These biases create substantial disincentives for teachers and/or principals to seek employment in settings with a) low average performing students, b) low income students and c) high shares of non-proficient special education students. Creating such a disincentive is more likely to exacerbate disparities in teacher quality across settings than to improve it.

Teacher Preparation Institutions

While to date, the New Jersey Department of Education has made no specific movement toward rating of teacher preparation institutions using the aggregate growth percentiles of recent graduates in the field, such a movement seems likely. The new Council for the Accreditation of Teacher Preparation standards requires that teacher preparation institutions employ their state metrics for evaluative purposes:

4.1.The provider documents, using value-added measures where available, other state-supported P-12 impact measures, and any other measures constructed by the provider, that program completers contribute to an expected level of P-12 student growth.[26]

The patterns of bias in SGPs being relatively clear, it would be disadvantageous for colleges of education to place their graduates in high poverty, low average performing schools, or schools with higher percentages of non-proficient special education students.

The Path Forward

Given what we know about the original purpose and design of student growth percentiles and what we have learned specifically about the characteristics of New Jersey’s Growth Percentile measures, we propose the following:

(i) An immediate moratorium on attaching any consequences – job action, tenure action or compensation to these measures. Given the available information, failing to do so would be reckless and irresponsible and further, is likely to lead to exorbitant legal expenses incurred by local public school districts obligated to defend the indefensible.

(ii) A general rethinking – back to square one – on how to estimate school and teacher effect, with particular emphasis on better models from the field. It may or may not, in the end, be a worthwhile endeavor to attempt to estimate teacher and principal effects using student assessment data. At the very least, the statistical strategy for doing so, along with the assessments underlying these estimates, require serious rethinking.

(iii) A general rethinking/overhaul of how data may be used to inform thoughtful administrative decision making, rather than dictate decisions.  Data including statistical estimates of school, program, intervention or teacher effects can be useful for guiding decision making in schools. But rigid decision frameworks, mandates and specific cut scores violate the most basic attributes of statistical measures. They apply certainty to that which is uncertain. At best, statistical estimates of effects on student outcomes may be used as preliminary information – a noisy pre-screening tool – for guiding subsequent, more in-depth exploration and evaluation.

Perhaps most importantly, NJDOE must reposition itself as an entity providing thoughtful, rigorous technical support for assisting local public school districts in making informed decisions regarding programs and services.  Mandating decision frameworks absent sound research support is unfair and sends the wrong message to educators who are in the daily trenches At best, the state’s failure to understand the disconnect between existing research and  current practices suggests  a need for critical  technical capacity. At worst, endorsing policy positions through a campaign of disinformation raises serious concerns.


[4] Goldhaber, D., & Walch, J. (2012). Does the model matter? Exploring the relationship between different student achievement-based teacher assessments. University of Washington at Bothell, Center for Education Data & Research. CEDR Working Paper 2012-6. Ehlert, M., Koedel, C., &Parsons, E., & Podgursky, M. (2012).  Selecting growth measures for school and teacher evaluations. National Center for Analysis of Longitudinal Data in Education Research (CALDAR). Working Paper #80.

[5] Baker, E.L., Barton, P.E., Darling-Hammond, L., Haertel, E., Ladd, H.F., Linn, R.L., Ravitch, D., Rothstein, R., Shavelson, R.J., & Shepard, L.A. (2010). Problems with the use of student test scores to evaluate teachers. Washington, DC: Economic Policy Institute.  Retrieved June 4, 2012, from http://epi.3cdn.net/724cd9a1eb91c40ff0_hwm6iij90.pdf. Corcoran, S.P. (2010). Can teachers be evaluated by their students’ test scores? Should they be? The use of value added measures of teacher effectiveness in policy and practice. Annenberg Institute for School Reform. Retrieved June 4, 2012, from http://annenberginstitute.org/pdf/valueaddedreport.pdf.

[6] Goldhaber, D., & Walch, J. (2012). Does the model matter? Exploring the relationship between different student achievement-based teacher assessments. University of Washington at Bothell, Center for Education Data & Research. CEDR Working Paper 2012-6.

[7] Ehlert, M., Koedel, C., &Parsons, E., & Podgursky, M. (2012).  Selecting growth measures for school and teacher evaluations. National Center for Analysis of Longitudinal Data in Education Research (CALDAR). Working Paper #80.

[8] See Briggs & Domingue’s (2011) re-analysis of LA Times estimates pages 10 to 12. Briggs, D. & Domingue, B. (2011). Due diligence and the evaluation of teachers: A review of the value-added analysis underlying the effectiveness rankings of Los Angeles Unified School District Teachers by the Los Angeles Times. Boulder, CO: National Education Policy Center. Retrieved June 4, 2012 from http://nepc.colorado.edu/publication/due-diligence.

[9] Briggs, D. & Betebenner, D., (2009, April). Is student achievement scale dependent? Paper presented at the invited symposium Measuring and Evaluating Changes in Student Achievement: A Conversation about Technical and Conceptual Issues at the Annual Meeting of the National Council for Measurement in Education, San Diego, CA. Retrieved June 4, 2012, from http://dirwww.colorado.edu/education/faculty/derekbriggs/Docs/Briggs_Weeks_Is%20Growth%20in%20Student%20Achievement%20Scale%20Dependent.pdf.

[10] American Institutes for Research. (2012). 2011-12 growth model for educator evaluation technical report: Final. November, 2012. New York State Education Department.

[11] Briggs and Betebenner (2009) explain: “However, there is an important philosophical difference between the two modeling approaches in that Betebenner (2008) has focused upon the use of SGPs as a descriptive tool to characterize growth at the student-level, while the LM (layered model) is typically the engine behind the teacher or school effects that get produced for inferential purposes in the EVAAS” (p. 30).

[12] McCaffrey, D.F., Sass, T.R., Lockwood, J.R., & Mihaly, K. (2009). The intertemporal variability of teacher effect estimates. Education Finance and Policy, 4,(4) 572-606. Sass, T.R. (2008). The stability of value-added measures of teacher quality and implications for teacher compensation policy. Retrieved June 4, 2012, from http://www.urban.org/UploadedPDF/1001266_stabilityofvalue.pdf. Schochet, P.Z. & Chiang, H.S. (2010). Error rates in measuring teacher and school performance based on student test score gains. Institute for Education Sciences, U.S. Department of Education. Retrieved May 14, 2012, from http://ies.ed.gov/ncee/pubs/20104004/pdf/20104004.pdf.

[13] Corcoran, S.P., Jennings, J.L., & Beveridge, A.A. (2010). Teacher effectiveness on high- and low-stakes tests. Paper presented at the Institute for Research on Poverty Summer Workshop, Madison, WI.

Gates Foundation (2010). Learning about teaching: Initial findings from the measures of effective teaching project. MET Project Research Paper. Seattle, Washington: Bill & Melinda Gates Foundation. Retrieved December 16, 2010, from http://www.metproject.org/downloads/Preliminary_Findings-Research_Paper.pdf.

[14] Ballou, D., Mokher, C.G., & Cavaluzzo, L. (2012, March). Using value-added assessment for personnel decisions: How omitted variables and model specification influence teachers’ outcomes. Paper presented at the Annual Meeting of the Association for Education Finance and Policy. Boston, MA.  Retrieved June 4, 2012, from http://aefpweb.org/sites/default/files/webform/AEFP-Using%20VAM%20for%20personnel%20decisions_02-29-12.docx.

Briggs, D. & Domingue, B. (2011). Due diligence and the evaluation of teachers: A review of the value-added analysis underlying the effectiveness rankings of Los Angeles Unified School District Teachers by the Los Angeles Times. Boulder, CO: National Education Policy Center. Retrieved June 4, 2012 from http://nepc.colorado.edu/publication/due-diligence.

[15] Betebenner, D., Wenning, R.J., & Briggs, D.C. (2011). Student growth percentiles and shoe leather. Retrieved June 5, 2012, from http://www.ednewscolorado.org/2011/09/13/24400-student-growth-percentiles-and-shoe-leather.

[16] Rubin, D. B., Stuart, E. A., & Zanutto, E. L. (2004). A potential outcomes view of value-added assessment in education. Journal of Educational and Behavioral Statistics, 29(1), 103–16.

[17]http://www.wnyc.org/articles/new-jersey-news/2013/mar/18/everything-you-need-know-about-students-baked-their-test-scores-new-jersy-education-officials-say/

[18] Briggs, D. & Domingue, B. (2011). Due Diligence and the Evaluation of Teachers: A review of the value-added analysis underlying the effectiveness rankings of Los Angeles Unified School District teachers by the Los Angeles Times. Boulder, CO: National Education Policy Center. Retrieved [date] from http://nepc.colorado.edu/publication/due-diligence.

[19] Alexander, K. L., Entwisle, D. R., & Olson, L. S. (2001). Schools, achievement, and inequality: A seasonal perspective. Educational Evaluation and Policy Analysis, 23(2), 171-191.

[20] Learning about Teaching: Initial Findings from the Measures of Effective Teaching Project. MET Project Research Paper. Seattle, Washington: Bill & Melinda Gates Foundation. Retrieved December 16, 2010, from http://www.metproject.org/downloads/Preliminary_Findings-Research_Paper.pdf.

[21] Lubienski, S. T., & Crane, C. C. (2010) Beyond free lunch: Which family background measures matter? Education Policy Analysis Archives, 18(11). Retrieved [date], from http://epaa.asu.edu/ojs/article/view/756

[22] For example, even value-added proponent Eric Hanushek finds in unrelated research that “students throughout the school test score distribution appear to benefit from higher achieving schoolmates.” See: Hanushek, E. A., Kain, J. F., Markman, J. M., & Rivkin, S. G. (2003). Does peer ability affect student achievement?. Journal of applied econometrics, 18(5), 527-544.

[24] Rothstein, J. (2011). Review of “Learning About Teaching: Initial Findings from the Measures of Effective Teaching Project.” Boulder, CO: National Education Policy Center. Retrieved [date] from http://nepc.colorado.edu/thinktank/review-learning-about-teaching. [accessed 2-may-13]

[25] Ehlert, M., Koedel, C., Parsons, E., & Podgursky, M. (2012). Selecting Growth Measures for School and Teacher Evaluations. http://ideas.repec.org/p/umc/wpaper/1210.html

Friday AM Graphs: Just how biased are NJ’s Growth Percentile Measures (school level)?

New Jersey finally released the data set of its school level growth percentile metrics. I’ve been harping on a few points on this blog this week.

SGP data here: http://education.state.nj.us/pr/database.html

Enrollment data here: http://www.nj.gov/education/data/enr/enr12/stat_doc.htm

First, that the commissioner’s characterization that the growth percentiles necessarily fully take into account student background is a completely bogus and unfounded assertion.

Second, that it is entirely irresponsible and outright reckless that they’ve chosen not even to produce technical reports evaluating this assertion.

Third, that growth percentiles are merely individual student level descriptive metrics that simply have no place in the evaluation of teachers, since they are not designed (by their creator’s acknowledgement) for attribution of responsibility for that student growth.

Fourth, that the Gates MET studies provide absolutely no validation of New Jersey’s choice to use SGP data in the way proposed regulations mandate.

So, this morning I put together four quick graphs of the relationship between school level percent free lunch and median SGPs in language arts and math and school level 7th grade proficiency rates and median SGPs in language arts and math. Just how bad is the bias in the New Jersey SGP/MGP data?  Well, here it is! (actually, it was bad enough to shock me)

First, if you are a middle school with higher percent free lunch, you are, on average likely to have a lower growth percentile rating in Math. Notably, the math ASK assessment has significant ceiling effect leading into middle grades, perhaps weakening this relationship. (more on this at a later point)Slide1

If your are a middle school with higher percent free lunch, you are, on average, likely to have a lower growth percentile rating in English Language Arts. This relationship is actually even more biased than the math relationship (uncommon for this type of analysis), likely because the ELA assessment suffers less ceiling effect problem.

Slide2As with many if not most SGP data, the relationship is actually even worse when we look at the correlation with average performance level of the school, or peer group. If your school has higher proficiency rates to begin with, your school will quite likely have a higher growth percentile ranking:

Slide3

The same applies for English Language Arts:

Slide4

Quite honestly these the worst – most biased – school level growth data I think I’ve ever seen.

They are worse than New York State.

They are much worse than New York City.

And they are worse than Ohio.

And this is just a first cut at them. I suspect that if I have actual initial scores or even school level scale scores, the relationship between those scores and growth percentile is even stronger. But will test that when opportunity presents itself.

Further, because the bias is so strong at the school level – it is likely also quite strong at the teacher level.

New Jersey’s school level MGPs are highly unlikely to be providing any meaningful indicator of the actual effectiveness of teachers, administrators and practices of New Jersey schools.  Rather, by conscious choice to ignore contextual factors of schooling (be it the vast variations in the daily lives of individual children, or the difficult to measure power of peer group context, and various  other social contextual factors), New Jersey’s growth percentile measures fail miserably.

No school can be credibly rated as effective or not based on these data, nor can any individual teacher be cast as necessarily effective or ineffective.

And this not at all unexpected.

Additional Graphs: Racial Bias

Slide5

Slide6

Just for fun, here’s a multiple regression model which yields additional factors that are statistically associated with school level MGPs. First and foremost, these factors explain over 1/3 of the variation in Language Arts MGPs. That is, Language Arts MGPs seem heavily contingent upon a) student demographics, b) location and c) grade range of school.  In other words, if we start using these data as a basis for de-tenuring teachers, we will likely be detenuring teachers quite unevenly with respect to a) student demographics, b) location and c) grade range… despite having little evidence that we are actually validly capturing teacher effectiveness – and substantial implication here that we are, in fact, NOT.

Patterns for math aren’t much different. Less variance is explained, again, I suspect because of the strong ceiling effect on math assessments in the upper elementary/middle grades. There appears to be a charter school positive effect in this regression, but I remain too suspicious of attaching any meaningful conclusions to these data. Besides, if we assert this charter effect to be true as a function of these MGPs being somehow valid, then we’d have to accept that charters like Robert Treat in Newark are doing a particularly poor job (very low MGP either compared to similar demographic schools, or similar average performance level schools).

School Level Regression of Predictors of Variation in MGPs

school mgp regression

*p<.05, **p<.10

At this point, I think it’s reasonable to request that the NJDOE turn over masked (removing student identifiers) versions of their data… the student level SGP data (with all relevant demographic indicators), matched to teachers, attached to school IDs, and also including certifying institutions of each teacher.  These data require thorough vetting at this point as it would certainly appear that they are suspect as a school evaluation tool. Further, any bias that becomes apparent to this degree at the school level – which is merely an aggregation of teacher/classroom level data – indicates that these same problems exist in the teacher level data. Given the employment consequences here, it is imperative that NJDOE make these data available for independent review.

Until these data are fully disclosed (not just their own analyses of them, which I expect to be cooked up any day now), NJDOE and the Board of Education should immediately cease moving forward on using these data either for any consequential decisions either for schools or individual teachers. And if they do not, school administrators, local boards of education and individual teachers and teacher preparation institutions (which are also to be rated by this shoddy information) should JUST SAY NO!

A few more supplemental analyses

Slide1

Slide2

Slide3

Slide4


Briefly Revisiting the Central Problem with SGPs (in the creator’s own words)

When I first criticized the use of SGPs for teacher evaluation in New Jersey, the creator of the Colorado Growth Model responded with the following statement:

Unfortunately Professor Baker conflates the data (i.e. the measure) with the use. A primary purpose in the development of the Colorado Growth Model (Student Growth Percentiles/SGPs) was to distinguish the measure from the use: To separate the description of student progress (the SGP) from the attribution of responsibility for that progress.

http://www.ednewscolorado.org/voices/student-growth-percentiles-and-shoe-leather

I responded here.

Let’s parse this statement one more time. The goal, of the SGP approach, as applied in the Colorado Growth Model and subsequently in other states is to:

…separate the description of student progress (the SGP) from the attribution of responsibility for that progress.

To evaluate the effectiveness of a teacher on influencing student progress, one must certainly be able to attribute responsibility for that progress to the teacher. If SGP’s aren’t designed to attribute that responsibility, then they aren’t designed for evaluating teacher effectiveness, and thus aren’t a valid factor for determining whether a teacher should have his/her tenure revoked on the basis of their ineffectiveness.

It’s just that simple!

Employment lawyers, save the quote and link above for cross examination of Dr. Betebenner when teachers start losing their tenure status and/or are dismissed primarily on the basis of his measures – which by his own recognition – are not designed to attribute responsibility for student growth to them (the teachers) or any other home, school or classroom factor that may be affecting that growth.

(Reiterating again that while value added models do attempt to isolate teacher effect, they just don’t do a very good job at it).


On Misrepresenting (Gates) MET to Advance State Policy Agendas

In my previous  post I chastised state officials for their blatant mischaracterization of metrics to be employed in teacher evaluation. This raised (in twitter conversation) the issue of the frequent misrepresentation of findings from the Gates Foundation Measures of Effective Teaching Project (or MET). Policymakers frequently invoke the Gates MET findings as providing broad based support for however they might choose to use, whatever measures they might choose to use (such as growth percentiles).

Here is one example in a recent article from NJ Spotlight (John Mooney) regarding proposed teacher evaluation regulations in New Jersey:

New academic paper: One of the most outspoken critics has been Bruce Baker, a professor and researcher at Rutgers’ Graduate School of Education. He and two other researchers recently published a paper questioning the practice, titled “The Legal Consequences of Mandating High Stakes Decisions Based on Low Quality Information: Teacher Evaluation in the Race-to-the-Top Era.” It outlines the teacher evaluation systems being adopted nationwide and questions the use of SGP, specifically, saying the percentile measures is not designed to gauge teacher effectiveness and “thus have no place” in determining especially a teacher’s job fate.

The state’s response: The Christie administration cites its own research to back up its plans, the most favored being the recent Measures of Effective Teaching (MET) project funded by the Gates Foundation, which tracked 3,000 teachers over three years and found that student achievement measures in general are a critical component in determining a teacher’s effectiveness.

I asked colleague Morgan Polikoff of the University of Southern California for his comments. Note that Morgan and I aren’t entirely on the same page on the usefulness of even the best possible versions of teacher effect (on test score gain) measures… but we’re not that far apart either.  It’s my impression that Morgan believes that better estimated measures can be more valuable – more valuable than I perhaps think they can be in policy decision making. My perspective is presented here (and Morgan is free to provide his).  My skepticism in part arises from my perception that there is neither interest among or incentive for state policymakers to actually develop better measures (as evidenced in my previous post). And that I’m not sure some of the major issues can ever be resolved.

That aside, here are Morgan Polikoff’s comments regarding misrepresentation of the Gates MET findings – in particular, as applied to states adopting student growth percentile measures:

As a member of the Measures of Effective Teaching (MET) project research team, I was asked by Bruce to pen a response to the state’s use of MET to support its choice of student growth percentiles (SGPs) for teacher evaluations. Speaking on my behalf only (and not on behalf of the larger research team), I can say that the MET project says nothing at all about the use of SGPs. The growth measures used in the MET project were, in fact, based on value-added models (VAMs) (http://www.metproject.org/downloads/MET_Gathering_Feedback_Research_Paper.pdf). The MET project’s VAMs, unlike student growth percentiles, included an extensive list of student covariates, such as demographics, free/reduced-price lunch, English language learner, and special education status.

Extrapolating from these results and inferring that the same applies to SGPs is not an appropriate use of the available evidence. The MET results cannot speak to the differences between SGP and VAM measures, but there is both conceptual and empirical evidence that VAM measures that control for student background characteristics are more conceptually and empirically appropriate (link to your paper and to Cory Koedel’s AEFP paper). For instance, SGP models are likely to result in teachers teaching the most disadvantaged students being rated the poorest (cite Cory’s paper). This may result in all kinds of negative unintended consequences, such as teachers avoiding teaching these kinds of students.

In short, state policymakers should consider all of the available evidence on SGPs vs. VAMs, and they should not rely on MET to make arguments about measures that were not studied in that work.

Morgan

Citations:

Baker, B.D., Oluwole, J., Green, P.C. III (2013) The legal consequences of mandating high stakes decisions based on low quality information: Teacher evaluation in the race-to-the-top era. Education Policy Analysis Archives, 21(5). This article is part of EPAA/AAPE’s Special Issue On Value-Added: What America’s Policymakers Need to Know and Understand, Guest Edited by Dr. Audrey Amrein-Beardsley and Assistant Editors Dr. Clarin Collins, Dr. Sarah Polasky, and Ed Sloat. Retrieved [date], from http://epaa.asu.edu/ojs/article/view/1298

Ehlert, M., Koedel, C., Parsons, E., & Podgursky, M. (2012). Selecting Growth Measures for School and Teacher Evaluations. http://ideas.repec.org/p/umc/wpaper/1210.html

(Updated alternate version:

http://economics.missouri.edu/working-papers/2012/WP1210_koedel.pdf)


Who will be held responsible when state officials are factually wrong? On Statistics & Teacher Evaluation

While I fully understand that state education agencies are fast becoming propaganda machines, I’m increasingly concerned with how far this will go.  Yes, under NCLB, state education agencies concocted completely wrongheaded school classification schemes that had little or nothing to do with actual school quality, and in rare cases, used those policies to enforce substantive sanctions on schools. But, I don’t recall many state officials going to great lengths to prove the worth – argue the validity – of these systems. Yeah… there were sales-pitchy materials alongside technical manuals for state report cards, but I don’t recall such a strong push to advance completely false characterizations of the measures. Perhaps I’m wrong. But either way, this brings me to today’s post.

I am increasingly concerned with at least some state officials’ misguided rhetoric promoting policy initiatives built on information that is either knowingly suspect, or simply conceptually wrong/inappropriate.

Specifically, the rhetoric around adoption of measures of teacher effectiveness has become driven largely by soundbites that in many cases are simply factually WRONG.

As I’ve explained before…

  • With value added modeling, which does attempt to parse statistically the relationship between a student being assigned to teacher X and that students achievement growth, controlling for various characteristics of the student and the student’s peer group, there still exists a substantial possibility of random-error based mis-classification of the teacher or remaining bias in the teacher’s classification (something we didn’t catch in the model affected that teacher’s estimate). And there’s little way of knowing what’s what.
  • With student growth percentiles, there is no attempt to parse statistically the relationship between a student being assigned a particular teacher and the teacher’s supposed responsibility for that student’s change among her peers in test score percentile rank.

This article explains these issues in great detail.

And this video may also be helpful.

Matt Di     Carlo has written extensively about the question of whether and how well value-added modes actually accomplish their goal of fully controlling for student backgrounds.

Sound Bites don’t Validate Bad or Wrong Measures!

So, let’s take a look at some of the rhetoric that’s flying around out there and why and how it’s WRONG.

New Jersey has recently released its new regulations for implementing teacher evaluation policies, with heavy reliance on student growth percentile scores, ultimately aggregated to the teacher level as median growth percentiles. When challenged about whether those growth percentile scores will accurately represent teacher effectiveness, specifically for teachers serving kids from different backgrounds, NJ Commissioner Christopher Cerf explains:

“You are looking at the progress students make and that fully takes into account socio-economic status,” Cerf said. “By focusing on the starting point, it equalizes for things like special education and poverty and so on.” (emphasis added)

http://www.wnyc.org/articles/new-jersey-news/2013/mar/18/everything-you-need-know-about-students-baked-their-test-scores-new-jersy-education-officials-say/

Here’s the thing about that statement. Well, two things. First, the comparisons of individual students don’t actually explain what happens when a group of students is aggregated to their teacher and the teacher is assigned the median student’s growth score to represent his/her effectiveness, where teacher’s don’t all have an evenly distributed mix of kids who started at similar points (to other teachers). So, in one sense, this statement doesn’t even address the issue.

More importantly, however, this statement is simply WRONG!

There’s little or no research to back this up, but for early claims of William Sanders and colleagues in the 1990s in early applications of value added modeling which excluded covariates. Likely, those cases where covariates have been found to have only small effects are cases in which those effects are drowned out by noise or other bias resulting from underlying test scaling (or re-scaling) issues – or alternatively, crappy measurement of the covariates. Here’s an example of the stepwise effects of adding covariates on teacher ratings.

Consider that one year’s assessment is given in April. The school year ends in late June. The next year’s test is given the next April. First, and tangential (to the covariate issue… but still important) there are approximately two months of instruction given by the prior year’s teacher that are assigned the current year’s teacher. Beyond that, there are a multitude of things that go on outside of the few hours a day where the teacher has contact with a child, that influence any given child’s “gains” over the year, and those things that go on outside of school vary widely by children’s economic status. Further, children with certain life experiences on a continued daily/weekly/monthly basis are more likely to be clustered with each other in schools and classrooms.

With annual test scores – differences in summer experiences (slide 20) which vary by student economic background matter – differences in home settings and access to home resources matters – differences in access to outside of school tutoring and other family subsidized supports may matter and depend on family resources.  Variations in kids’ daily lives more generally matter (neighborhood violence, etc.) and many of those variations exist as a function of socio-economic status.

Variations in peer group with whom children attend school matters, and also varies by socio-economic status, neighborhood structure, conditions, and varies by socioeconomic status of not just the individual child, but the group of children. (citations and examples available in this slide set)

In short, it is patently false to suggest that using the same starting point “fully takes into account socio-economic status.”

It’s certainly false to make such a statement about aggregated group comparisons – especially while never actually conducting or producing publicly any analysis to back such a ridiculous claim.

For lack of any larger available analysis of aggregated (teacher or school level) NJ growth percentile data, I stumbled across this graph from a Newark Public Schools presentation a short while back.

NPS SGP Bias

http://www.njspotlight.com/assets/12/1212/2110

Interestingly, what this graph shows is that the average score level in schools is somewhat positively associated with the median growth percentile, even within Newark where variation is relatively limited. In other words, schools with higher average scores appear to achieve higher gains. Peer group effect? Maybe. Underlying test scaling effect? Maybe. Don’t know. Can’t know.

The graph provides another dimension that is also helpful. It identifies lower and higher need schools – where “high need” are the lowest need in the mix. They have the highest average scores, and highest growth percentiles. And this is on the English/language arts assessment, where Math assessments tend to reveal stronger such correlations.

Now, state officials might counter that this pattern actually occurs because of the distribution of teaching talent… and has nothing to do with model failure to capture differences in student backgrounds. All of the great teachers are in those lower need, higher average performing schools! Thus, fire the others, and they’ll be awesome too! There is no basis for such a claim given that the model makes no attempt beyond prior score to capture student background.

Then there’s New York State, where similar rhetoric has been pervasive in the state’s push to get local public school districts to adopt state compliant teacher evaluation provisions in contracts, and to base those evaluations largely on state provided growth percentile measures. Notably, New York State unlike New Jersey actually realized that the growth percentile data required adjustment for student characteristics. So they tried to produce adjusted measures. It just didn’t work.

In a New York Post op-ed, the Chancellor of the Board of Regents opined:

The student-growth scores provided by the state for teacher evaluations are adjusted for factors such as students who are English Language Learners, students with disabilities and students living in poverty. When used right, growth data from student assessments provide an objective measurement of student achievement and, by extension, teacher performance. http://www.nypost.com/p/news/opinion/opedcolumnists/for_nyc_students_move_on_evaluations_EZVY4h9ddpxQSGz3oBWf0M

So, what’s wrong with that? Well… mainly… that it’s… WRONG!

First, as I elaborate below, the state’s own technical report on their measures found that they were in fact not an unbiased measure of teacher or principal performance:

Despite the model conditioning on prior year test scores, schools and teachers with students who had higher prior year test scores, on average, had higher MGPs. Teachers of classes with higher percentages of economically disadvantaged students had lower MGPs. (p. 1) https://schoolfinance101.files.wordpress.com/2012/11/growth-model-11-12-air-technical-report.pdf

That said, the Chancellor has cleverly chosen her words. Yes, it’s adjusted… but the adjustment doesn’t work. Yes, they are an objective measure. But they are still wrong. They are a measure of student achievement. But not a very good one.

But they are not by any stretch of the imagination, by extension, a measure of teacher performance. You can call them that. You can declare them that in regulations. But they are not.

To ice this reformy cake in New York, the Commissioner of Education has declared in letters to individual school districts regarding their evaluation plans, that any other measure they choose to add along side the state growth percentiles must be acceptably correlated with the growth percentiles:

The department will be analyzing data supplied by districts, BOCES and/or schools and may order a corrective action plan if there are unacceptably low correlation results between the student growth subcomponent and any other measure of teacher and principal effectiveness… https://schoolfinance101.wordpress.com/2012/12/05/its-time-to-just-say-no-more-thoughts-on-the-ny-state-tchr-eval-system/

Because, of course, the growth percentile data are plainly and obviously a fair, balanced objective measure of teacher effectiveness.

WRONG!

But it’s better than the Status Quo!

The standard retort is that marginally flawed or not, these measures are much better than the status quo. ‘Cuz of course, we all know our schools suck. Teachers really suck. Principals enable their suckiness.  And pretty much anything we might do… must suck less.

WRONG – it is absolutely not better than the status quo to take a knowingly flawed measure, or a measure that does not even attempt to isolate teacher effectiveness, and use it to label teachers as good or bad at their jobs. It is even worse to then mandate that the measure be used to take employment action against the employee.

It’s not good for teachers AND It’s not good for kids. (noting the stupidity of the reformy argument that anything that’s bad for teachers must be good for kids, and vice versa)

On the one hand, these ridiculous rigid, ill-conceived, statistically and legally inept and morally bankrupt policies will most certainly lead to increased, not decreased litigation over teacher dismissal.

On the other hand… The anything is better than the status quo argument is getting a bit stale and was pretty ridiculous to begin with.  Jay Matthews of the Washington Post acknowledged his preference for a return toward the status quo (suggesting different improvements) in a recent blog post, explaining:

We would be better off rating teachers the old-fashioned way. Let principals do it in the normal course of watching and working with their staff. But be much more careful than we have been in the past about who gets to be principal, and provide much more training.

In closing, the ham-fisted argument of the anti-status quo argument, as applied to teacher evaluation, is easily summarized as follows:

Anything > Status Quo

Where the “greater than” symbol implies “really freakin’ better than… if not totally awesome… wicked awesome in fact,” but since it’s all relative, it would have be “wicked awesomer.”

Because student growth measures exists and purport to measure student achievement growth which is supposed to be a teacher’s primary responsibility, it therefore counts as “something,” which is a subclass of “anything” and therefore it is better than the “status quo.” That is:

Student Growth Measures = “something”

Something ⊆ Anything (something is a subset of anything)

Something > Status Quo

Student Growth Measures > Current Teacher Evaluation

Again, where “>”  means “awesomer” even though we know that current teacher evaluation is anything but awesome.

It’s just that simple!

And this is the basis for modern education policymaking?

Gates Still Doesn’t Get It! Trapped in a World of Circular Reasoning & Flawed Frameworks

Not much time for a thorough review of the most recent release of the Gates MET project, but here are my first cut comments on the major problems with the report. The take home argument of the report seems to be that their proposed teacher evaluation models are sufficiently reliable for prime time use and that the preferred model should include about 33 to 50% test score based statistical modeling of teacher effectiveness coupled with at least two observations on every teacher. They come to this conclusion by analyzing data on 3,000 or so teachers across multiple cities.  They arrive at the 33 to 50% figure, coupled with two observations, by playing a tradeoff game. They find – as one might expect – that prior value added of a teacher is still the best predictor of itself a year later… but that when the weight on observations is increased, the year to year correlation for the overall rating increases (well, sort of). They still find relatively low correlations between value-added ratings for teachers on state tests and ratings for the same teachers with the same kids on higher order tests.

So, what’s wrong with all of this? Here’s my quick run-down:

1. Self-validating Circular Reasoning

I’ve written several previous posts explaining the absurdity of the general framework of this research which assumes that the “true indicator of teacher effectiveness” is the following year value-added score. That is, the validity of all other indicators of teacher effectiveness is measured by their correlation to the following year value added (as well as value-added when estimated to alternative tests – with less emphasis on this). Thus, the researchers find – to no freakin’ surprise – that prior year value added is, among all measures, the best predictor of itself a year later. Wow – that’s a revelation!

As a result, any weighting scheme must include a healthy dose of value-added.  But, because their “strongest” predictor of itself analysis put too much weight on VAM to be politically palatable, they decided to balance the weighting by considering year to year reliability (regardless of validity).

The hypocrisy of their circular validity test is best revealed in this quote from the study:

Teaching is too complex for any single measure of performance to capture it accurately.

But apparently the validity of any/all other measures can be assessed by the correlation with a single measure (VAM itself)!?????

See also:

Evaluating Evaluation Systems

Weak Arguments for Using Weak Indicators

2. Assuming Data Models Used in Practice are of Comparable Quality/Usefulness

I would go so far as to say that it is reckless to assert that the new Gates findings on this relatively select sub-sample of teachers (for whom high quality data were available on all measures over multiple years) have much if any implication for the usefulness of the types of measures and models being implemented across states and districts.

I have discussed the reliability and bias issues in New York City’s relatively rich value-added model on several previous occasions. The NYC model (likely among the “better” VAMs) produces results that are sufficiently noisy from year to year to raise serious questions about their usefulness. Certainly, one should not be making high stakes decisions based heavily on the results of that model. Further, averaging over multiple years means, in many cases, averaging scores that jump from the 30th to 70th percentile and back again.  In such cases, averaging doesn’t clarify, it masks. But what the averaging may be masking is largely noise. Averaging noise is unlikely to reveal a true signal!

Further, as I’ve discussed several times on this blog, many states and districts are implementing methods far more limited than a “high quality” VAM and in some cases states are adopting growth models that don’t attempt – or only marginally attempt – to account for any other factors that may affect student achievement over time.  Even when those models to make some attempts to account for differences in students served, in many cases as in the recent technical report on the model recommended for use in New York State, those models fail! And they fail miserably.  But despite the fact that those models fail so miserably at their central, narrowly specified task (parsing teacher influence on test score gain) policymakers continue to push for their use in making high stakes personnel decisions.

The new Gates findings – while not explicitly endorsing use of “bad” models – arguably embolden this arrogant, wrongheaded behavior!  The report has a responsibility to be clearer as to what constitutes a better and more appropriate model versus what constitutes an entirely inappropriate one.

See also:

Reliability of NYC Value-added

On the stability of being Irreplaceable (NYC data)

Seeking Practical uses of the NYC VAM data

Comments on the NY State Model

If it’s not valid, reliability doesn’t matter so much (SGP & VAM)

3. Continued Preference for the Weighted Components Model

Finally, my biggest issue is that this report and others continue to think about this all wrong. Yes, the information might be useful, but not if forced into a decision matrix or weighting system that requires the data to be used/interpreted with a level of precision or accuracy that simply isn’t there – or worse – where we can’t know if it is.

Allow me to copy and paste one more time the conclusion section of an article I have coming out in late January:

As we have explained herein, value-added measures have severe limitations when attempting even to answer the narrow question of the extent to which a given teacher influences tested student outcomes. Those limitations are sufficiently severe such that it would be foolish to impose on these measures, rigid, overly precise high stakes decision frameworks.  One simply cannot parse point estimates to place teachers into one category versus another and one cannot necessarily assume that any one individual teacher’s estimate is necessarily valid (non-biased).  Further, we have explained how student growth percentile measures being adopted by states for use in teacher evaluation are, on their face, invalid for this particular purpose.  Overly prescriptive, overly rigid teacher evaluation mandates, in our view, are likely to open the floodgates to new litigation over teacher due process rights, despite much of the policy impetus behind these new systems supposedly being reduction of legal hassles involved in terminating ineffective teachers.

This is not to suggest that any and all forms of student assessment data should be considered moot in thoughtful management decision making by school leaders and leadership teams. Rather, that incorrect, inappropriate use of this information is simply wrong – ethically and legally (a lower standard) wrong. We accept the proposition that assessments of student knowledge and skills can provide useful insights both regarding what students know and potentially regarding what they have learned while attending a particular school or class. We are increasingly skeptical regarding the ability of value-added statistical models to parse any specific teacher’s effect on those outcomes. Further, the relative weight in management decision-making placed on any one measure depends on the quality of that measure and likely fluctuates over time and across settings. That is, in some cases, with some teachers and in some years, assessment data may provide leaders and/or peers with more useful insights.  In other cases, it may be quite obvious to informed professionals that the signal provided by the data is simply wrong – not a valid representation of the teacher’s effectiveness.

Arguably, a more reasonable and efficient use of these quantifiable metrics in human resource management might be to use them as a knowingly noisy pre-screening tool to identify where problems might exist across hundreds of classrooms in a large district. Value-added estimates might serve as a first step toward planning which classrooms to observe more frequently. Under such a model, when observations are completed, one might decide that the initial signal provided by the value-added estimate was simply wrong. One might also find that it produced useful insights regarding a teacher’s (or group of teachers’) effectiveness at helping students develop certain tested algebra skills.

School leaders or leadership teams should clearly have the authority to make the case that a teacher is ineffective and that the teacher even if tenured should be dismissed on that basis. It may also be the case that the evidence would actually include data on student outcomes – growth, etc. The key, in our view, is that the leaders making the decision – indicated by their presentation of the evidence – would show that they have used information reasonably to make an informed management decision. Their reasonable interpretation of relevant information would constitute due process, as would their attempts to guide the teacher’s improvement on measures over which the teacher actually had control.

By contrast, due process is violated where administrators/decision makers place blind faith in the quantitative measures, assuming them to be causal and valid (attributable to the teacher) and applying arbitrary and capricious cutoff-points to those measures (performance categories leading to dismissal).   The problem, as we see it, is that some of these new state statutes require these due process violations, even where the informed, thoughtful professional understands full well that she is being forced to make a wrong decision. They require the use of arbitrary and capricious cutoff-scores. They require that decision makers take action based on these measures even against their own informed professional judgment.

See also:

The Toxic Trifecta: Bad Measurement & Evolving Teacher Evaluation Policies

Thoughts on Data, Assessment & Informed Decision Making in Schools